. 2025 Jan 27;10(1):43.
doi: 10.1038/s41392-025-02128-8.

The cryptic lncRNA-encoded microprotein TPM3P9 drives oncogenic RNA splicing and tumorigenesis

Affiliations

The cryptic lncRNA-encoded microprotein TPM3P9 drives oncogenic RNA splicing and tumorigenesis

Kun Meng et al. Signal Transduct Target Ther. .

Abstract

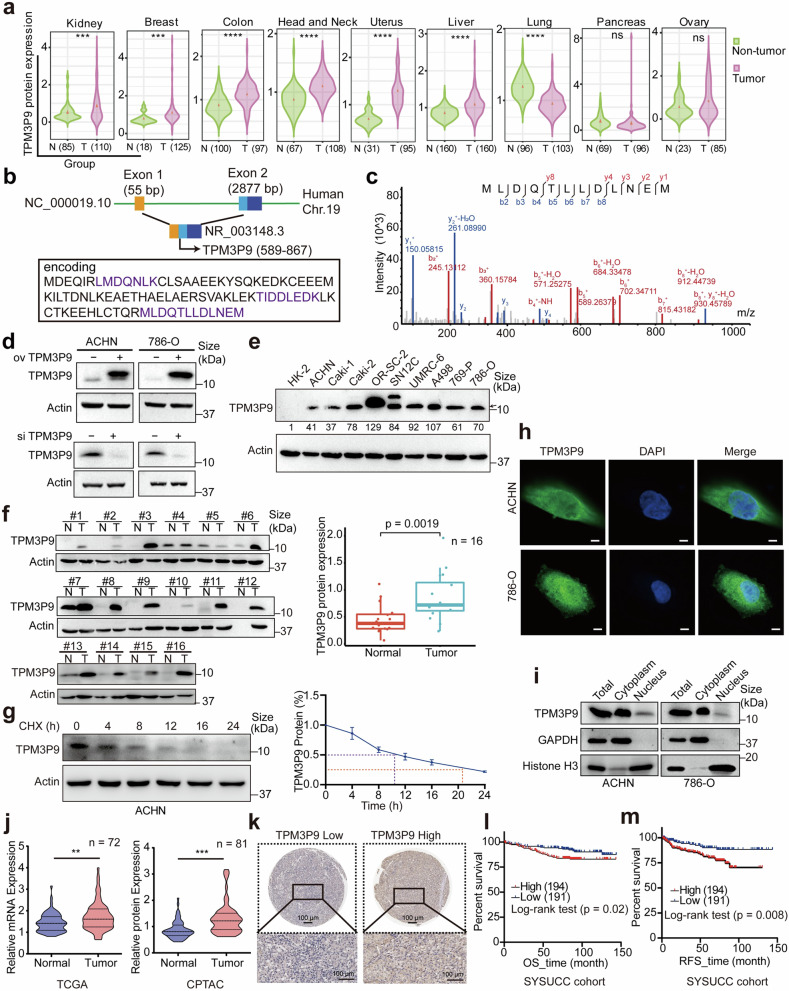
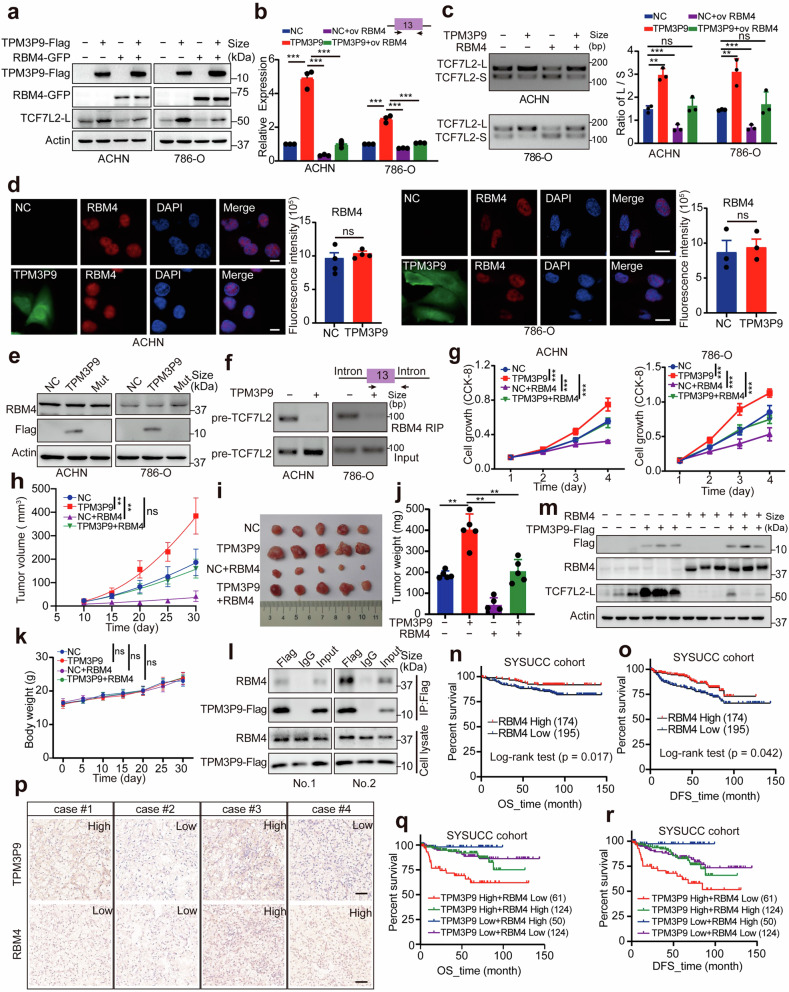
Emerging evidence demonstrates that cryptic translation from RNAs previously annotated as noncoding might generate microproteins with oncogenic functions. However, the importance and underlying mechanisms of these microproteins in alternative splicing-driven tumor progression have rarely been studied. Here, we show that the novel protein TPM3P9, encoded by the lncRNA tropomyosin 3 pseudogene 9, exhibits oncogenic activity in clear cell renal cell carcinoma (ccRCC) by enhancing oncogenic RNA splicing. Overexpression of TPM3P9 promotes cell proliferation and tumor growth. Mechanistically, TPM3P9 binds to the RRM1 domain of the splicing factor RBM4 to inhibit RBM4-mediated exon skipping in the transcription factor TCF7L2. This results in increased expression of the oncogenic splice variant TCF7L2-L, which activates NF-κB signaling via its interaction with SAM68 to transcriptionally induce RELB expression. From a clinical perspective, TPM3P9 expression is upregulated in cancer tissues and is significantly correlated with the expression of TCF7L2-L and RELB. High TPM3P9 expression or low RBM4 expression is associated with poor survival in patients with ccRCC. Collectively, our findings functionally and clinically characterize the "noncoding RNA"-derived microprotein TPM3P9 and thus identify potential prognostic and therapeutic factors in renal cancer.


Conflict of interest statement

Competing interests: The authors declare no competing interests.

Figures

Fig. 1
Fig. 1
Cryptic translation of microproteins hidden in lncRNAs in human cancers. a Schematic representation showing an overview of pan-cancer types and their distributions in the CPTAC cohort (Created with BioRender.com). b The chromosomal distribution of LEPs identified in the CPTAC cohort. LEPs expressed in >30% of the tumor tissues or non-tumor tissues within a specific sample type were considered to be identified. c The number of LEPs identified in tumor tissues for each sample type. LEPs identified in 30% of the tumor samples were considered to be expressed in the tumor samples. d Flower plot. The petals represent the unique LEPs identified for each cancer type, and the core represents LEPs identified in all cancer types. e The expression levels of the three LEPs identified in all nine cancer types, with the size of the dot indicating positive rates and the color representing the cancer type. f Differentially expressed LEPs between tumor and non-tumor samples in the CPTAC cohort. Volcano plot showing the LEPs with |fold change | ≥ 1.5 and p < 0.05. g Schematic representation showing an overview of pan-cancer types and their distributions in the SYSUCC cohort (Created with BioRender.com). h Heatmap showing the LEPs identified in the SYSUCC cohort. LEPs expressed in >30% of the samples within a cancer type were considered to be identified
Fig. 2
Fig. 2
The novel microprotein TPM3P9 is upregulated in ccRCC, and its upregulation is correlated with poor prognosis. a Violin plot showing the expression levels of the lncRNA-TPM3P9 encoded microprotein TPM3P9 in pan-cancer and non-tumorous tissues. ***p < 0.001; ****p < 0.0001; ns, nonsignificant. b Schematic representation of the microprotein TPM3P9 translated from lncRNA-TPM3P9, with the transcript NR_003148.3. Unique peptides are visually represented in purple. c The representative unique peptide of TPM3P9 was identified by shotgun mass spectrometry of ccRCC cell lines. d Verification of endogenous and exogenous TPM3P9 expression in ccRCC cells with TPM3P9 overexpression or knockdown, using a TPM3P9-specific antibody in western blot analysis. e Western blot showing the significant upregulation of TPM3P9 in ccRCC cell lines compared to human kidney HK-2 cells. The black arrow represents the destination blots. f Western blot showing significant upregulation of TPM3P9 in ccRCC tissues compared with adjacent non-tumorous tissues. The statistical plot demonstrates the high expression of TPM3P9 in renal cancer tissues. n = 16. g The degradation half-life of TPM3P9 was detected in ACHN cells treated with cycloheximide. Data from three biological replicates are shown as mean ± SEM. h Immunofluorescence staining assay demonstrates the cytosolic and nuclear distribution of TPM3P9 in ccRCC cells with a TPM3P9-specific antibody. Nuclei were stained with DAPI (blue), and TPM3P9 was stained with green. Scale bar, 5 μm. i The nuclear-cytoplasmic fractionation experiment confirms the expression of TPM3P9 in both the cytoplasmic and nuclear compartments. j The expression of TPM3P9 RNA (left) or protein levels (right) in paired ccRCC and adjacent non-tumor tissues in TCGA and CPTAC cohorts, respectively. **p < 0.01; ***p < 0.001. k Representative immunohistochemistry staining of TPM3P9 in ccRCC with high or low expression. Scale bar,100 μm. l, m Kaplan–Meier survival analyses indicated that ccRCC patients with high TPM3P9 expression had shorter overall survival (l, p < 0.05, log-rank test) and relapse-free survival (m, p < 0.01, log-rank test)
Fig. 3
Fig. 3
The novel microprotein TPM3P9 promotes ccRCC proliferation. a Two plasmids encoding TPM3P9-Flag (TPM3P9) and TPM3P9-mut-Flag (Mut) were constructed. To generate the mutant, the translation initiation codon ATG was mutated to ATT to abolish protein translation. b Western blot analysis using anti-TPM3P9 and anti-Flag antibodies showed that the TPM3P9 protein was overexpressed only in ccRCC cells with the wild-type ORF. c TPM3P9 mRNA expression was upregulated in ccRCC cells transfected with either the wild-type or mutant TPM3P9 ORF. ****p < 0.0001. d CCK-8 assays were performed to test the growth ability of both ccRCC cell lines transfected with the indicated constructs. **p < 0.01; ns, nonsignificant. e Colony formation assays were performed to assess the colony formation ability of both ccRCC cell lines transfected with the indicated constructs. **p < 0.01; ***p < 0.001. f EdU assays were performed to evaluate the proliferation ability of both ccRCC cells transfected with the indicated constructs. **p < 0.01; ***p < 0.001. Bars, SEMs. Scale bar, 50 μm. g Western blot validation of TPM3P9 knockdown efficiency of the indicated sgRNAs in ccRCC cells. h CCK-8 assays were performed to test the growth ability of both ccRCC cell lines transfected with the indicated sgRNAs. **p < 0.01. i Colony formation assays were performed to test the colony formation ability of ccRCC cells transfected with the indicated sgRNAs. **p < 0.01; ***p < 0.001. Bars, SEMs. j EdU assays were performed to test the proliferation ability of both ccRCC cell lines transfected with the indicated sgRNAs. *p < 0.05; **p < 0.01. Bars, SEMs. Scale bar, 50 μm. k Mouse xenograft model showing that knockdown of TPM3P9 significantly inhibited tumor growth. **p < 0.01. l, m A mouse xenograft model was established by injection of control or TPM3P9-silenced ACHN cells, with tumor volume (l) and tumor weight (m) shown. Data from 5 mice per group are presented. **p < 0.01. n The body weight of the nude mice was monitored. ns, nonsignificant
Fig. 4
Fig. 4
The microprotein TPM3P9 regulates the oncogenic RNA splicing of TCF7L2. a GSEA of ccRCC proteomic data and TCGA data showing that TPM3P9 is involved in the spliceosome pathway. b Enrichment analysis suggested that the proteins co-expressed with TPM3P9 were related to RNA splicing. c Pie chart based on RNA sequencing showing the distribution of alternative splicing changes following TPM3P9 overexpression in ACHN and 786-O cells. d Schematic representation of TCF7L2 alternative splicing and its splice variants. e RT-PCR validation of the increased expression of the TCF7L2-L variant in cells overexpressing the TPM3P9 protein. f The results of qRT-PCR using a specific primer pair confirmed the increase in the expression of the TCF7L2-L variant upon overexpression of the TPM3P9 protein.***p < 0.001.  g Preparation of an antibody specific to the TCF7L2-L variant. h Western blot validation of the successful preparation of the anti-TCF7L2-L antibody and exogenous overexpression of the TCF7L2-L and TCF7L2-S variants. The HA-tag was fused with TCF7L2-L or TCF7L2-S. i Western blot showing the upregulation of the TCF7L2-L variant in cells ectopically expressing TPM3P9-Flag (TPM3P9) but not in those ectopically expressing TPM3P9-mut-Flag (Mut). j, k Knockdown of TCF7L2-L inhibited the ability of TPM3P9 to promote ccRCC cell proliferation. The expression of TCF7L2-L was measured by qRT-PCR (j), and the cell growth ability was confirmed by a CCK-8 assay (k). *p < 0.05; ***p < 0.001. Bars, SEMs. l, m Overexpression of TCF7L2-L reversed the inhibitory effect of TPM3P9 silencing on ccRCC cell growth. The expression of TCF7L2-L was measured by qRT-PCR (l), and the cell growth ability was confirmed by a CCK-8 assay (m). **p < 0.01; ***p < 0.001. Bars, SEMs. np Mouse xenograft model showing that overexpression of TCF7L2-L reversed TPM3P9 silencing-mediated inhibition of proliferation in ACHN cells. Tumor volume (n), tumor weight (o), and the increase in tumor volume over time (p) in nude mice. **p < 0.01; ns, nonsignificant. Bars, SD. q The body weight of the nude mice was monitored. ns, nonsignificant
Fig. 5
Fig. 5
The microprotein TPM3P9 binds to RBM4 and suppresses TCF7L2 exon skipping. a Diagram showing the workflow of RNA pulldown combined with high-resolution mass spectrometry to identify proteins binding to TCF7L2 pre-mRNA. The diagram was edited using Adobe Illustrator. b Coomassie blue staining showing TCF7L2 pre-mRNA pulled down with RNA probes. The black arrows represent the lanes with significant differences. c Venn diagram showing a total of 65 proteins potentially interacting with TCF7L2 pre-mRNA. d Diagram showing the workflow of Co-IP combined with high-resolution mass spectrometry to identify TPM3P9-interacting proteins. The diagram was edited using Adobe Illustrator. e Silver staining showing proteins specifically bind to TPM3P9; specific bands are highlighted with red arrows. f Venn diagram showing 23 proteins potentially interacting with both TPM3P9 and the TCF7L2 pre-mRNA. g A PPI network of these proteins potentially interacting with both TPM3P9 and the TCF7L2 pre-mRNA was constructed using Cytoscape software. h The PPI network of the five interaction partners closely associated with TPM3P9 and the TCF7L2 pre-mRNA. i RNA pulldown with the TCF7L2 pre-mRNA probe was performed to validate the interaction between TCF7L2 pre-mRNA and RBM4. j Co-IP assays using an anti-Flag antibody were performed to detect the interaction between TPM3P9 and RBM4 in ACHN and 786-O cells. k Co-IP assays using an anti-GFP antibody were performed to detect the interaction between TPM3P9 and RBM4 in ACHN and 786-O cells expressing TPM3P9-Flag
Fig. 6
Fig. 6
The exploration of the binding region of TPM3P9 and RBM4. a Diagram of plasmids encoding GFP-tagged full-length RBM4 (RBM4-GFP) and GFP-tagged RBM4 truncations (RBM4-N-GFP and RBM4-C-GFP). The diagram was edited using Adobe Illustrator. b The indicated GFP-tagged wild-type RBM4 and mutant RBM4 plasmids as well as the TPM3P9-Flag plasmid were transfected into HEK293T cells, and co-immunoprecipitation with an antibody specific to GFP revealed that RBM4-GFP and RBM4-N-GFP, but not RBM4-C-GFP, were capable of binding to TPM3P9. The black arrows represent the destination blots. c The indicated GFP-tagged wild-type RBM4 and mutant RBM4 plasmids as well as the TPM3P9-Flag plasmid were transfected into HEK293T cells, and coimmunoprecipitation with an antibody specific for Flag revealed that RBM4-GFP and RBM4-N-GFP but not RBM4-C-GFP were capable of binding to TPM3P9. The black arrows represent the destination blots. d Diagram of plasmids encoding the RBM4 N-terminal truncations lacking RRM1 (N1-GFP), RRM2 (N2-GFP), or both RRM1 and RRM2 (N3-GFP). The diagram was edited using Adobe Illustrator. e, f The indicated GFP-tagged N-terminal domain deletion mutants of RBM4 were co-transfected with TPM3P9-Flag into HEK293T cells, and co-immunoprecipitation was performed using an antibody specific for Flag (e) or GFP (f); the results showed that both N1-GFP and N3-GFP, without the RRM1 motif, could not bind to TPM3P9. g RNA immunoprecipitation (RIP) showing the binding ability of different RBM4 truncations to TCF7L2 pre-mRNA. h Crosslinking immunoprecipitation coupled with high-throughput sequencing (CLIP-seq) analysis of RBM4 revealed that RBM4 specifically crosslinked to an intron upstream of exon 13 in TCF7L2 pre-mRNA. i The minigene assay and RIP assay using a binding sequence mutant with a mutation in the intron upstream of exon 13 confirmed that RBM4 bound only to the wild-type TCF7L2 pre-mRNA
Fig. 7
Fig. 7
The microprotein TPM3P9 inhibits RBM4-mediated TCF7L2 RNA splicing. a Western blot results showing that overexpression of RBM4 dramatically abrogated the TPM3P9-mediated increase in TCF7L2-L protein expression. b qRT-PCR results showing that RBM4 dramatically abrogated the TPM3P9-mediated increase in TCF7L2-L mRNA expression. ***p < 0.001. c RT-PCR results showing that the increase in the TCF7L2-L/TCF7L2-S ratio induced by TPM3P9 overexpression was reversed to the control level when RBM4 was overexpressed. **p < 0.01; ***p < 0.001; ns, nonsignificant. d Immunofluorescence staining showing that TPM3P9 overexpression did not affect the cellular localization or expression of the RBM4 protein. Nuclei were stained with DAPI (blue), TPM3P9 (green), and RBM4 (red). The staining intensity of RBM4 (red) was quantified. Unpaired two-tailed Student’s t-test; ns, nonsignificant. Bars, SEMs; scale bars, 10 μm (left) and 20 μm (right). e Western blot results showing that TPM3P9 overexpression did not affect the expression of the RBM4 protein in ccRCC cells. f RIP assay results showing that TPM3P9 overexpression weakened the binding ability of RBM4 to TCF7L2 pre-mRNA in ccRCC cells. g Overexpression of RBM4 restored the TPM3P9-mediated promotion of ccRCC cell growth. ***p < 0.001. h Mouse xenograft model showing that overexpression of RBM4 significantly inhibited tumor growth promoted by TPM3P9 overexpression. **p < 0.01; ns, nonsignificant. i, j Mouse xenograft model established with ACHN cells. Tumor growth (i), and tumor weight (j) are shown. Data are shown as the mean ± SD for 5 mice per group. Unpaired two-tailed Student’s t-test; **p < 0.01. k The body weight of the nude mice was monitored. ns, nonsignificant. l Co-IP assay results verifying the interaction between RBM4 and TPM3P9 in in vivo tumor samples. m Western blot results showing that RBM4 overexpression abolished the upregulation of TCF7L2-L mediated by TPM3P9 in in vivo tumor samples. n Kaplan–Meier survival analysis results showing that high RBM4 expression was associated with favorable overall survival in ccRCC patients in the SYSUCC cohort (p < 0.05, log-rank test). o Kaplan–Meier survival analysis showing that high RBM4 expression was associated with favorable disease-free survival in ccRCC patients in the SYSUCC cohort (p < 0.05, log-rank test). p Immunohistochemical data revealing the correlation between TPM3P9 and RBM4 expression in ccRCC patients. Scale bars, 50 μm. q Kaplan–Meier analysis of overall survival revealed that in the SYSUCC cohort, ccRCC patients with both high TPM3P9 and low RBM4 expression had the worst prognosis, while patients with both low TPM3P9 and high RBM4 expression had the best prognosis (p < 0.05, log-rank test). r Kaplan–Meier analysis of disease-free survival showed that in the SYSUCC cohort, ccRCC patients with both high TPM3P9 and low RBM4 expression had the worst prognosis, while patients with both low TPM3P9 and high RBM4 expression had the best prognosis (p < 0.05, log-rank test)
Fig. 8
Fig. 8
TCF7L2-L transcriptionally upregulates RELB to activate NF-κB signaling. a Diagram showing the process for RNA-seq analysis of ccRCC cells with control plasmid, TCF7L2-L variant, or TCF7L2-S variant overexpression. b Heatmap showing the genes upregulated in cells transfected with TCF7L2-L but with unchanged expression in cells transfected with TCF7L2-S compared to control cells. c Comparative analysis of the TCF7L2-S and TCF7L2-L groups revealing that the NF-κB pathway was the predominant pathway enriched in the differentially expressed proteins. d Five essential upregulated genes (RELB, CCL2, IL4I1, PTX3, and TNFAIP3) were identified by overlapping the genes upregulated by overexpression of TCF7L2-L with those upregulated by overexpression of TPM3P9. e qRT-PCR was performed to validate the upregulation of RELB and TNFAIP3 mRNA expression after the overexpression of TPM3P9 in ACHN and 786-O cells. *p < 0.05; **p < 0.01; ***p < 0.001; ns, nonsignificant. f Western blot analysis confirmed that the overexpression of the TPM3P9 protein, but not the corresponding lncRNA, upregulated RELB protein expression in ccRCC cells. g Western blot analysis confirmed that ectopic expression of the TCF7L2-L variant but not the TCF7L2-S variant noticeably induced the expression of RELB in ccRCC cells. h Co-IP using an anti-HA antibody followed by MS was performed to identify the coregulatory factors of TCF7L2-L. The diagram was edited using Adobe Illustrator. i Coomassie blue staining showing the proteins that specifically bind to TCF7L2-L; specific bands are highlighted with black arrows. j The Venn diagram shows that 27 proteins that bound specifically to TCF7L2-L but not to TCF7L2-S. k Co-IP assays were performed using an anti-HA antibody to verify the interaction between the HA-TCF7L2-L variant and SAM68 in ACHN and 786-O cells. The HA-TCF7L2-S variant and the empty vector were used as controls. l Co-IP assays were performed using an anti-SAM68 antibody to detect the interaction between TCF7L2-L and SAM68 in ccRCC cells. m Western blot analysis confirmed that silencing TCF7L2-L or SAM68 noticeably attenuated the induction of RELB expression in ccRCC cells overexpressing TPM3P9. n The predicted sequence motifs for TCF7L2 binding DNA. Two potential sequences in the RELB promoter were predicted to bind to TCF7L2. o Dual luciferase reporter assays revealed that the activity of motif No.1 but not that of motif No.2 was increased by TPM3P9 overexpression, and this increase was strongly attenuated by treatment with siRNA targeting TCF7L2-L or SAM68. ***p < 0.001; ns, nonsignificant. p CCK-8 assays were performed to test the growth ability of ccRCC cells transfected with the indicated constructs. **p < 0.01. qu Immunohistochemical and correlation analyses were performed in the SYSUCC cohort, comprising 385 clinical samples, to analyze the expression correlations of TPM3P9 with TCF7L2-L (q), RELB with TPM3P9 (r), SAM68 with TPM3P9 (s), RELB with TCF7L2-L (t), and RELB with SAM68 (u)
Fig. 9
Fig. 9
Hypothetical model. The microprotein TPM3P9 encoded by lncRNA-TPM3P9, is a tumor-promoting protein that drives kidney cancer proliferation. TPM3P9 interacts with the N-terminus of the RNA-binding protein RBM4, inhibiting RBM4’s regulatory effect on exon 13 skipping in TCF7L2 pre-mRNA, thereby facilitating the formation of the TCF7L2-L variant. TCF7L2-L further binds to the transcription factor SAM68 to promote the transcription of RELB, and thus activating the NF-κB signaling pathway and enhancing ccRCC cell proliferation. The diagram was edited using Adobe Illustrator

References

    1. Venter, J. C. et al. The sequence of the human genome. Science291, 1304–1351 (2001). - PubMed
    1. Chen, B. et al. Targeting non-coding RNAs to overcome cancer therapy resistance. Signal Transduct. Target. Ther.7, 121 (2022). - PMC - PubMed
    1. Chen, J. et al. Pervasive functional translation of noncanonical human open reading frames. Science367, 1140–1146 (2020). - PMC - PubMed
    1. Lee, D. S. M. et al. Disrupting upstream translation in mRNAs is associated with human disease. Nat. Commun.12, 1515 (2021). - PMC - PubMed
    1. Kesner, J. S. et al. Noncoding translation mitigation. Nature617, 395–402 (2023). - PMC - PubMed

LinkOut - more resources