. 2025 Jan 26;16(1):1047.
doi: 10.1038/s41467-025-56348-1.

Genome-wide profiling of tRNA modifications by Induro-tRNAseq reveals coordinated changes

Affiliations

Genome-wide profiling of tRNA modifications by Induro-tRNAseq reveals coordinated changes

Yuko Nakano et al. Nat Commun. .

Abstract

While all native tRNAs undergo extensive post-transcriptional modifications as a mechanism to regulate gene expression, mapping these modifications remains challenging. The critical barrier is the difficulty of readthrough of modifications by reverse transcriptases (RTs). Here we use Induro-a new group-II intron-encoded RT-to map and quantify genome-wide tRNA modifications in Induro-tRNAseq. We show that Induro progressively increases readthrough over time by selectively overcoming RT stops without altering the misincorporation frequency. In a parallel analysis of Induro vs. a related RT, we provide comparative datasets to facilitate the prediction of each modification. We assess tRNA modifications across five human cell lines and three mouse tissues and show that, while the landscape of modifications is highly variable throughout the tRNA sequence framework, it is stabilized for modifications that are required for reading of the genetic code. The coordinated changes have fundamental importance for development of tRNA modifications in protein homeostasis.


Conflict of interest statement

Competing interests: Y.N., H.G., H.M, S.M, J.L., N.S.L., J.A.P., R.K, B.D.G., and Y.M.H. declare no competing interests. Z.S., K.K., E.Y., S.G., and N.N. are employees of New England Biolabs, Inc., where Z.S. performed data analysis, K.K. and S.G. performed Illumina sequencing of tRNAseq libraries, and E.Y. and N.N. provided discussion. New England Biolabs is a manufacturer and vendor of molecular biology reagents, including Induro, Rnl2, T4 PNK, restriction enzymes, and several buffers used in this study. These authors declare no competing interests. The affiliation of Z.S., K.K., E.Y., S.G., and N.N. with New England Biolabs does not affect these authors’ impartiality, adherence to journal standards and policies, or objective data presentation, analysis, and interpretation.

Figures
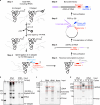
Fig. 1
Fig. 1. The Induro-tRNAseq workflow.
a Preparing tRNAseq library. Step 1, total RNA including charged and uncharged tRNAs, where a black ball depicts the amino acid, is extracted from cells or tissues and used directly unless specified. The A76 of uncharged tRNA is removed by β-elimination, while aa-tRNAs are unaffected and are deacylated in a buffer, pH 9.5. Step 2, a 3’-barcoded adapter is ligated to the 3’-end of deacylated tRNAs by T4 Rnl2 via a DNA splint (turquoise). Several tRNA libraries are combined to start a multiplex workflow. Step 3, an RT primer is hybridized to the 3’-adapter to initiate cDNA synthesis by Induro. Step 4, cDNA products are gel purified and circularized by Circligase. Step 5, PCR amplification of the circularized cDNA by Q5 DNA polymerase with a barcode 2-containing primer and a universal primer (purple). Step 6, the final gel-purified barcoded library contains tRNA sequence (black), barcode 1 (red), and barcode 2 (blue). b A denaturing gel of tRNA ligated with the 3’-adapter after step 2. L: 62-mer and 121-mer DNA ladders. c A denaturing gel of cDNA products after reverse transcription by Induro in step 3. cDNA products of 90–180 nts were excised and extracted from the gel. L: small range RNA ladder (NEB); none: a control RT reaction without input RNA; FL: cDNA of full-length tRNA. d A non-denaturing gel image of the DNA library after PCR amplification in step 5. Double-stranded DNAs (dsDNAs) of 150–240 base pairs (bps) were excised and extracted. L: O’RangeRuler 10 bp DNA ladder + GeneRuler 50 bp DNA ladder (Thermo Fisher). All gels were stained with SYBR gold. bd Each reaction step was analyzed by gels at least 5 times, showing a representative gel, while the uncropped gel scan is in Source Data 1.
Fig. 2
Fig. 2. Validation of Induro-tRNAseq.
a Differential abundance of isodecoders of cyto-tRNAs and mt-tRNAs of K562 cells as identified by Induro-tRNAseq (n = 2, biological replicates) and by mim-tRNAseq (n = 2). The Induro workflow detected 266 cyto-tRNAs and the TGIRT workflow detected 265 cyto-tRNAs, while both detected all 22 isodecoders of mt-tRNAs. Shown in each comparison are log-transformed read counts normalized by DESeq2, showing the Pearson correlation coefficient r. b Differential abundance of isodecoders of cyto-tRNAs and mt-tRNAs starting with total RNA vs. total tRNA from K562 cells by Induro-tRNAseq (n = 2, biological replicates). The dataset consisted of cyto-tRNAs (266, 281 in two duplicates) and mt-tRNAs (22 in each sample). c Differential changes of abundance of isoacceptors of cyto-tRNAs and mt-tRNAs of HEK293T cells in sodium arsenite (SA)-induced oxidative stress as detected by the Induro workflow. The abundance of each isoacceptor in the presence of 100 µM or 300 µM of SA relative to the absence of SA was calculated (n = 4, two biological replicates and two technical replicates). d Bar graphs represent the abundance of mt-Met(CAT) and iMet(CAT) (n = 4) of data in (c). Individual data points are indicated. Error bars, mean ± 95% confidence interval. e Differential changes of tRNA charging levels of HEK293T cells in SA-induced oxidative stress as detected by the Induro workflow. The charging level of each isoacceptor was the percentage of the charged reads with 3’-CCA end relative to the total reads of the isoacceptor. X-axis and Y-axis indicate the difference in charging at 100 µM and 300 µM of SA (n = 4, two biological replicates and two technical replicates). f Bar graphs showing the percentage of charged reads of mt-Met(CAT) and iMet(CAT) (n = 4) of data in (e). Individual data points are indicated. Error bars, mean ± 95% confidence interval.
Fig. 3
Fig. 3. Maximum readthrough in Induro-tRNAseq.
a The L-shaped tRNA structure showing RT-readable modifications. b Yield of readthrough (%) in end-to-end cDNA synthesis at 25, 37, 42, and 55 °C after the Induro RT reaction for 1, 2, or 16 h. Data were collected from total RNA of K562 cells as the input (n = 2; technical replicates). Center line: median; box limits: upper and lower quartiles; whiskers: 1.5X interquartile range; points: outliers. N.D.; Not detectable. **p < 0.01; two-tailed unpaired t-test. c Heatmaps of the frequency (%) of the RT misincorporations and RT stops at the annotated modifications. d Left: A scatter plot showing the frequency (%) of the RT misincorporation as a function of the G9:m1G9 ratio of the transcript of human mt-Leu(TAA) (n = 2; technical replicates). Right: The frequency of misincorporation of the native mt-Leu(TAA) in sequencing analysis of a total RNA sample. Data were collected from K562 cells with total RNA as the input under the RT reaction at 42 °C for 16 h (n = 2; technical replicates). Source data containing p values and n values are provided in Source Data 2.
Fig. 4
Fig. 4. Sensitivity of Induro readthrough to environments.
a The frequency (%) of readthrough at m1A9 and m1A58. Data were collected from total RNA of K562 cells (n = 2; technical replicates for individual RT conditions). b The frequency (%) of readthrough at m1G9 and m1G37. Data were collected from total RNA of K562 cells (n = 2; technical replicates for individual RT conditions). c Top chart: the frequency (%) of RT misincorporation. Middle chart: the frequence (%) of RT stop in the presence of Mg2+ or Mn2+ as the only divalent metal ion. Data were collected from total RNA of K562 cells (n = 2; technical replicates for individual RT conditions). Unmodified natural nucleotides at tRNA positions 70, 74, and 75 were used as the control. A modification is identified if misincorporation is detected over 10%, which is marked by the red lines. Bottom chart: the number of detectable modifications in the presence of Mg2+ or Mn2+. ac Center line: median; box limits: upper and lower quartiles; whiskers: 1.5X interquartile range; points: outliers. *p < 0.05, **p < 0.01, ***p < 0.001; two-tailed unpaired t-test. All p values and n values used for statistical analysis are available in Source Data 4–6. d, e The frequency (%) of RT misincorporation in the presence of Mg2+ vs. Mn2+ at m7G (d) and at Ψ (e), showing the Pearson correlation coefficient r.
Fig. 5
Fig. 5. Two datasets of each modification.
a Cumulative bar graphs show the frequency (%) of RT stops (pink) and RT misincorporations (blue) detected by Induro and by TGIRT at each readable modification as averaged from all tRNA isodecoders of K562 cells, in relation to the frequency (%) of correct reads (white) and of lost coverage (gray). The % of RT stops at a given position was the number of stops relative to the number of total reads. b The frequency (%) of RT stops at each readable and annotated modification detected by Induro and by TGIRT. c The number of reads at each annotated modification site among all isodecoders detected by Induro and by TGIRT. d The distribution of read identity (in %) of each readable modification as detected from total tRNA of K562 cells by Induro and by TGIRT in response to the upstream nucleotide. e, f The read identity (%) of m1A9 vs. m1A58 (e), and of m1G9 vs. m1G37 (f) generated by Induro and by TGIRT. All data were collected from K562 cells. For all of the plots, the analysis of Induro was based on this work (n = 4, biological replicates), while that of TGIRT was extracted from the published dataset. Center line: median; box limits: upper and lower quartiles; whiskers: 1.5X interquartile range; points: outliers. Student’s t-test was performed by a two-sided analysis (*p < 0.05, **p < 0.01). Source data are provided in Source Data 8-10, where p values and n values used for statistical analysis are available.
Fig. 6
Fig. 6. Changes of tRNA modifications across mouse tissues.
a Sequence and cloverleaf structure of mouse Arg(TCT)−4, showing the C50U mutation. b A differential abundance analysis of isodecoders of cyto- and mt-tRNAs from 12-week-old WT (B6N) and mutant (B6J) mice (n = 6, 3 biological replicates, 2 technical replicates of each). The number of cyto-tRNAs detected was 205 and 213 in WT and mutant, respectively, while all 22 mt-tRNAs were detected in both. Each comparison is shown with log-transformed read counts normalized by DESeq2 with the Pearson correlation coefficient r. c The frequency (%) of RT misincorporation at major modification sites in all tRNAs of cerebellum, kidney, or spleen of B6N mice (n = 6, from 3 biological replicates and 2 technical replicates). Center line: median; box limits: upper and lower quartiles; whiskers: 1.5X interquartile range; points: outliers. Student’s t-test was performed by a two-sided analysis. d, e The relative level of acp3U detected by LC-MS/MS in three tissues of B6N mouse (d, n = 9; 3 biological replicates, each 3 technical replicates) and B6J mouse (e, n = 6; 2 biological replicates, each 3 technical replicates) normalized by total nucleosides of each tissue sample. The acp3U level in the spleen was used as the reference. Error bars, mean ± 95% confidence interval. Student’s t-test was performed by a two-sided analysis. Source data are provided for ion counts in Source data 11. f, g Differential misincorporation frequencies (%) between the cerebellum and the kidney of B6N (f) and between the cerebellum and the spleen of B6N (g), showing isodecoders that exhibit lower frequencies in the cerebellum at position 20.
Fig. 7
Fig. 7. Coordinated changes of tRNA modifications across cell types and tissues.
a Violin plots showing differences of the weighted RT misincorporation frequencies (%) at the most variable site of ASL or non-ASL modifications among isodecoders. SH-SY5Y & HeLa & K562, 2 biological replicates, each 2 technical replicates; HEK293T & HAP1, 2 biological replicates; mouse tissues, each 3 biological replicates. b Dataset of a in bar graphs. c Dataset of b in bar graphs at the major sites of ASL and non-ASL modifications in mouse tissues. d Datasets of c in bar graphs at position 32 (left) and 20 (right). e Dataset of (b) in bar graphs at the major sites of ASL and non-ASL modifications in human cells. f Datasets of e in bar graphs at position 32 (left) and 20 (right). Error bars, mean ± 95% standard error, by a two-sided Wilcoxon test (*p < 0.05, **p < 0.01, ***p < 0.001). g Violin plots showing the fraction of modifications (%) in the consistency scale across human cell lines and mouse tissues. A modification of consistency of 100% means that it is present in all 5 human cell lines, while a consistency of 80% means that it is present in 4 of the 5 cell lines. Student’s t-test by a two-sided analysis. h A landscape of coordinated changes of tRNA modifications across tissues and cell types. The charged aa-tRNA is shown with the amino acid as a star; the ribosome is drawn as a cartoon with the large and small subunits, while the mRNA is drawn with abundant codons (triplets without a margin) and rare codons (triplets with a margin), where the distance between each marked codon indicates the presence of unmarked codons. af Individual data points, p values and n values for statistical analysis are available in Source Data 12−19.

References

    1. Pan, T. Modifications and functional genomics of human transfer RNA. Cell Res28, 395–404 (2018). - PMC - PubMed
    1. Suzuki, T. The expanding world of tRNA modifications and their disease relevance. Nat. Rev. Mol. Cell Biol.22, 375–392 (2021). - PubMed
    1. Dedon, P. C. & Begley, T. J. Dysfunctional tRNA reprogramming and codon-biased translation in cancer. Trends Mol. Med28, 964–978 (2022). - PMC - PubMed
    1. Liu, F. et al. ALKBH1-mediated tRNA demethylation regulates translation. Cell167, 816–828 e816 (2016). - PMC - PubMed
    1. Chan, C. T. et al. A quantitative systems approach reveals dynamic control of tRNA modifications during cellular stress. PLoS Genet6, e1001247 (2010). - PMC - PubMed

LinkOut - more resources