. 2025 Jan 26;16(1):1059.
doi: 10.1038/s41467-025-56280-4.

Statistical identification of cell type-specific spatially variable genes in spatial transcriptomics

Affiliations

Statistical identification of cell type-specific spatially variable genes in spatial transcriptomics

Lulu Shang et al. Nat Commun. .

Abstract

An essential task in spatial transcriptomics is identifying spatially variable genes (SVGs). Here, we present Celina, a statistical method for systematically detecting cell type-specific SVGs (ct-SVGs)-a subset of SVGs exhibiting distinct spatial expression patterns within specific cell types. Celina utilizes a spatially varying coefficient model to accurately capture each gene's spatial expression pattern in relation to the distribution of cell types across tissue locations, ensuring effective type I error control and high power. Celina proves powerful compared to existing methods in single-cell resolution spatial transcriptomics and stands as the only effective solution for spot-resolution spatial transcriptomics. Applied to five real datasets, Celina uncovers ct-SVGs associated with tumor progression and patient survival in lung cancer, identifies metagenes with unique spatial patterns linked to cell proliferation and immune response in kidney cancer, and detects genes preferentially expressed near amyloid-β plaques in an Alzheimer's model.


Conflict of interest statement

Competing interests: The authors declare no competing interests.

Figures

Fig. 1
Fig. 1. Overview of Celina.
Celina is a method for identifying cell type-specific spatially variable genes (ct-SVGs) for both single-cell resolution (top left) and spot-resolution (top right) spatial transcriptomics. For a cell type of interest, Celina examines one gene at a time and takes as input the gene expression vector y, the cell type proportion (for spot-resolution data), or cell type indicator (for single-cell resolution data) vector x for the cell type of interest, any necessary covariates (W), and location information which is used for calculating the kernel matrix K. It relies on a spatially varying coefficient model to relate the gene’s spatial expression pattern to the cell type proportions across tissue locations and uses random effects to disentangle the cell type specific expression b. We assume that b, apart from encompassing the mean, can be further decomposed into two additional components: the spatial component bs, representing the part of cell type-specific gene expression explained by spatial correlation across locations; and the non-spatial component br, representing the part of cell type-specific gene expression not explained by spatial correlation across locations. Importantly, Celina relies on different kernel matrices K to capture a wide variety of cell type-specific expression patterns and outputs a combined p-value for each gene indicating the significance of the cell type-specific expression pattern.
Fig. 2
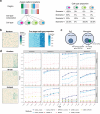
Fig. 2. Simulation results for spot-resolution spatial transcriptomics data.
a Simulation scheme. The simulated tissue contains four distinct rectangular spatial domains, each consisting of four distinct cell types. The composition of cell types in each spatial domain is varied to create four different simulation scenarios. b Left: a representative null gene displays random spatial expression pattern in simulation scenario II. Right: true cell type proportions are displayed on the tissue for the cell type of interest in simulation scenario II. c Left: each null simulation contains 1000 genes, among which 200 are cell type marker genes/SVGs (200). Right: each alternative simulation contains 1000 genes, among which 180 are cell type maker genes/SVGs but not ct-SVGs while 100 are ct-SVGs. d Left: representative genes display the three spatial expression patterns (Gradient, Streak and Hotspot) in simulation scenario II. Right: power plots show the proportion of true positives (y-axis) detected by different methods at a range of FDR (x-axis) in the alternative simulations for different methods (represented by different colors and line types) across the three spatial expression patterns. Simulations were performed under baseline setting. Source data are provided as a Source Data file.
Fig. 3
Fig. 3. Results on the human lung cancer data.
a Comparison of algorithm convergence rates and p-value distributions for Celina and CSIDE (n = 3813 spots). Top: boxplot shows the proportion of genes that achieved convergence in Celina and CSIDE. Middle: histogram displays the observed p-values from Celina in the permuted (green) and real data (purple). Bottom: histogram displays the observed p-values from CSIDE in the permutated (green) and real data (purple). In the boxplot, the center line, box limits and whiskers denote the median, upper, and lower quartiles, and 1.5 × interquartile range, respectively. b The number of overlaps (y-axis) between the top genes identified by Celina and CSIDE and known functional genes in existing databases (four panels), for top 100, 200, 300, 400, and 500 genes (x-axis). c Analysis of metagenes in tumor ct-SVGs. Tumor ct-SVGs identified by Celina are classified into three groups based on their distinct spatial expression patterns. The mean gene expression of each group is represented by a metagene displayed on the tissue. d Heatmap shows Pearson’s correlation between hallmark pathway scores (rows) and metagene expression (columns). e Detection of tumor boundary using ct-SVGs by Celina. Left: Spatial domains detected using ct-SVGs by Celina, with an important tumor boundary region displayed by red color. Right: Spatial domains detected using SVGs missed the tumor boundary. f The top 5 gene sets identified in the gene set enrichment analysis on genes differentially expressed in the tumor boundary region. Fisher’s one-tailed test is used for functional enrichment analyses and the default option g:SCS method in gProfiler2 is used for multiple testing correction. g Spatial expression pattern for three tumor ct-SVGs, MTDH, TAP1 and LRP8, identified by Celina (upper). Survival analysis using MTDH, TAP1 or LRP8 in TCGA, with p-values calculated using a two-sided log-rank test (bottom). h Trajectory analysis on tumor region. Top: visualization of tumor cell type proportion. Bottom: tumor stage trajectory in tumor region. i Expression level (y-axis) of transcription factors (Left) and their target genes (Right) is visualized along the tumor stage pseudotime (x-axis). Color represents four tumor subregions and solid line is fitted through linear regression. Source data are provided as a Source Data file.
Fig. 4
Fig. 4. Results on the human kidney cancer data.
a Comparison of algorithm convergence rates and p-value distributions for Celina and CSIDE (n = 2917 spots for tumor core and 2048 spots for tumor interface). Left: boxplot shows the proportion of genes that achieved convergence for different methods in the tumor core (upper) and tumor interface (lower). Middle: histogram displays observed p-values from Celina in permuted (green) and real data (purple). Right: histogram displays observed p-values from CSIDE in permutated (green) and real data (purple). In the boxplot, the center line, box limits and whiskers denote the median, upper, and lower quartiles, and 1.5 × interquartile range, respectively. b The number of overlaps (y-axis) between the top genes identified by Celina (red) or CSIDE (green) and known functional genes in public databases, for the top 100, 200, 300, 400, and 500 genes (x-axis). c Spatial expression pattern for three example ct-SVGs by Celina in RCC cells in the tumor core (upper) and tumor interface (lower). d Left: Scatter plot shows -log10(p-value) for RCC ct-SVGs in the tumor core (x-axis) versus the tumor interface (y-axis). Each gene is labeled as red if it is significant in both datasets, grey if it is not significant in either dataset, blue if it is only significant in tumor core, and yellow if it is only significant in tumor interface. Right: Visualization of RCC cell type proportion in the tumor core (upper) and tumor interface (lower). e Survival analysis of the three ct-SVGs in RCC cells using TCGA, with p-value calculated using a two-sided log-rank test. f Analysis of metagenes in RCC cells in the tumor core (upper) and tumor interface (lower). Color represents relative metagene expression levels (blue for high; white for low). g Left: visualizing the proximal tubule (PT, left) and epithelial-to-mesenchymal transition (EMT, middle) meta-programs in the tumor core (upper) and tumor interface (lower). Right: Pearson’s correlation between six meta-programs and metagenes in the tumor core (upper) and tumor interface (lower). Source data are provided as a Source Data file.
Fig. 5
Fig. 5. Results on the Alzheimer mouse hippocampus data.
a Comparison of algorithm convergence rates and p-value distributions for Celina and CSIDE (n = 10,372 cells). Top: Boxplot shows the proportion of genes that successfully converged for Celina and CSIDE. Middle: Histogram displays the observed p-values from Celina in the permuted (green) and real data (purple). Bottom: Histogram displays the observed p-values from CSIDE in permuted (green) and real data (purple). In the boxplot, the center line, box limits and whiskers denote the median, upper, and lower quartiles, and 1.5 × interquartile range, respectively. b Number of overlaps between the top genes identified by Celina or CSIDE and known functional genes in public databases. c Visualization of Aβ plaques observed in the mouse Alzheimer’s hippocampus data. Color represents plaques (purple) and cells (yellow). d Cell type proportion of five cell types (Left) and the spatial expression pattern of five ct-SVGs (Middle) on the tissue, with their expression stratified by distance to Aβ plaque (Right). Asterisks denote significantly different gene expression in the first distance interval compared to the >50 um interval. Two-sided Wilcoxon rank test is used with p-value being 0.04, 0.01, 0.03, 0.03 and 0.02 for five genes respectively, *p-value < 0.05. In the boxplot, the center line, box limits and whiskers denote the median, upper, and lower quartiles, and 1.5 × interquartile range, respectively with the center line denoting the mean value of the expression. e Cell type proportion of two cell types (Left) and the expression level of two example ct-SVGs (Right) on the tissue. Source data are provided as a Source Data file.
Fig. 6
Fig. 6. Results on the axolotl brain data.
a Spatial distribution of cell types in the axolotl brain (Left) and on the UMAP (Right) for CP (choroid plexus), EGC (ependymoglial cells), Immature Neuron, Mature Neuron, NBL (neuroblasts), and VLMC (vascular leptomeningeal cell). b Boxplot shows the proportion of genes that successfully converged in different methods (n = 4410 cells). In the boxplot, the center line, box limits and whiskers denote the median, upper, and lower quartiles, and 1.5 × interquartile range, respectively. c Histogram shows observed p-values from different methods in the permuted (green) and real data (purple). d Number of overlaps (y-axis) between the top genes identified by different methods and known marker genes, for the top 20, 60, 100, 140, and 180 top genes (x-axis). e Spatial expression pattern for example ct-SVGs identified by Celina in EGC cells. f UMAP plot for the same ct-SVGs. Source data are provided as a Source Data file.

Similar articles

Cited by

References

    1. Chen, K. H., Boettiger, A. N., Moffitt, J. R., Wang, S. & Zhuang, X. RNA imaging. Spatially resolved, highly multiplexed RNA profiling in single cells. Science348, aaa6090 (2015). - PMC - PubMed
    1. Moffitt, J. R. et al. High-throughput single-cell gene-expression profiling with multiplexed error-robust fluorescence in situ hybridization. Proc. Natl. Acad. Sci. USA113, 11046–11051 (2016). - PMC - PubMed
    1. Moffitt, J. R. et al. High-performance multiplexed fluorescence in situ hybridization in culture and tissue with matrix imprinting and clearing. Proc. Natl. Acad. Sci. USA113, 14456–14461 (2016). - PMC - PubMed
    1. Wei, X. et al. Single-cell Stereo-seq reveals induced progenitor cells involved in axolotl brain regeneration. Science377, eabp9444 (2022). - PubMed
    1. Genomics, X. 10X Genomics: visium spatial gene expression. (2020).

MeSH terms

LinkOut - more resources