. 2025 Jan 27;23(1):45.
doi: 10.1186/s12951-025-03097-4.

Immunomodulation effects of collagen hydrogel encapsulating extracellular vesicles derived from calcium silicate stimulated-adipose mesenchymal stem cells for diabetic healing

Affiliations

Immunomodulation effects of collagen hydrogel encapsulating extracellular vesicles derived from calcium silicate stimulated-adipose mesenchymal stem cells for diabetic healing

Yen-Hong Lin et al. J Nanobiotechnology. .

Abstract

Diabetic wounds are characterized by chronic inflammation, reduced angiogenesis, and insufficient collagen deposition, leading to impaired healing. Extracellular vesicles (EVs) derived from adipose-derived mesenchymal stem cells (ADSC) offer a promising cell-free therapeutic strategy, yet their efficacy and immunomodulation can be enhanced through bioactivation. In this study, we developed calcium silicate (CS)-stimulated ADSC-derived EVs (CSEV) incorporated into collagen hydrogels to create a sustained-release system for promoting diabetic wound healing. CSEV exhibited enhanced protein content, surface marker expression, and bioactive cargo enriched with pro-angiogenic and anti-inflammatory factors. In vitro, CSEV-loaded collagen significantly reduced reactive oxygen species production, promoted cell proliferation and migration compared to standard EV-loaded collagen. Cytokine profiling revealed the upregulation of anti-inflammatory cytokines and extracellular matrix components, highlighting their immunomodulatory and regenerative potential. In vivo, histological evaluation of diabetic rabbit models treated with CSEV-loaded collagen revealed superior reepithelialization and organized collagen deposition, indicating accelerated wound closure. These findings underscore the potential of CSEV-loaded collagen hydrogels as an innovative and effective therapeutic platform for enhancing diabetic wound healing by simultaneously addressing inflammation and tissue regeneration.

Keywords: Calcium silicate; Diabetic wound healing; Extracellular vesicles; Immunomodulation.


Conflict of interest statement

Declarations. Ethics approval and consent to participate: Not applicable. Consent for publication: Not applicable. Competing interests: Dr. Mei-Chih Chen is employed by Shine Out Bio Technology Co., Ltd., Taichung, Taiwan. All other authors confirm they have no conflicts of interest.

Figures

Fig. 1
Fig. 1
Schematic representation of the experimental process and therapeutic application of CSEV for diabetic wound healing. The top-left panel illustrates the stimulation of ADSC by calcium (Ca) and silicon (Si) ions to produce EVs enriched with growth factors and anti-inflammatory cytokines. The lower-left panel shows the FiberCell System used for large-scale production of CSEV. The right section outlines the application of CSEV-loaded collagen hydrogel on diabetic wounds, with the progression from an untreated wound to a repaired state. The treatment aims to support wound healing, angiogenesis, hair follicle neogenesis, and reduce inflammation
Fig. 2
Fig. 2
XRD pattern of CS with peaks corresponding to dicalcium silicate (C2S) and tricalcium silicate (C3S) phases. (B) SEM image of CS showing its flaky and angular structure. (C) The concentration of Ca and Si ions released from CS after 1 day of immersion. (D) The proliferation of ADSC cultured in a CS-conditioned medium at different time points compared to Ctl groups. Protein expression related to angiogenesis in ADSC was analyzed using a protein array after 1 day of treatment with CS extracts, utilizing three separate samples for testing. Data are presented as mean ± SD, and * indicates statistical significance (p < 0.05). (E) Heatmap showing the expression levels of cytokines and growth factors, including VEGF, FGF-2, HGF, Ang-1, IL-10, IL-1RA, TGF-β, and collagen I (Col I), in ADSC cultured with or without CS-conditioned medium. Three replicates were used for each condition to assess protein expression
Fig. 3
Fig. 3
Comparison of EVs secreted by ADSC under normal culture conditions (EV) and CS extraction solution (CSEV). (A) TEM images of EV and CSEV with spherical morphology and well-defined lipid bilayers. The scale bar is 100 nm. (B) Particle size distribution of EV and CSEV analyzed by NTA. (C) Zeta potential of EV and CSEV showing surface charge differences. (D) Total protein content of EV and CSEV per 109 particles. (E-G) Expression ratios of CD9, CD63, and CD81 surface markers in EV and CSEV. (H) Western blot analysis of EV-specific markers CD63, CD9, Alix, HSP70, and TSG101, with β-tubulin as a loading control. Data are presented as mean ± SD, and * indicates statistical significance (p < 0.05). (I) The proportions of CD73 and CD146 on different EV surfaces
Fig. 4
Fig. 4
(A) Cell viability of HDF cultured under different glucose concentrations (8 mM, 13.5 mM, 19 mM, and 25 mM) for 1, 3, and 5 days. (B) Cell cycle distribution of HDF under normal glucose (NG, 8 mM) and high glucose (HG, 25 mM) conditions at Day 0, Day 1, and Day 5, assessed by flow cytometry. Data are presented as mean ± SD, and * indicates statistical significance (p < 0.05). (C) Fluorescence microscopy images of F-actin (red), EVs (green), and nuclei (blue) in HDF after 24 and 48 h of EV or CSEV uptake. Scale bar is 50 μm. Flow cytometry analysis of EV and CSEV uptake in HDF, quantified as the percentage of cells positive for FITC fluorescence. (D) Flow cytometry analysis of ROS levels in HDFs treated with EV, CSEV, or control (Ctl). (E) Wound healing assay showing HDF migration after treatment with control, EV, or CSEV at 0 and 24 h. Scale bar is 150 μm. Quantification of HDF migration rate after 24 h of treatment. Data are presented as mean ± SD, and * indicates statistical significance compared to Ctl (p < 0.05), and # indicates statistical significance between EV and CSEV (p < 0.05)
Fig. 5
Fig. 5
(A) Cell viability of HUVEC cultured under different glucose concentrations (8 mM, 13.5 mM, 19 mM, and 25 mM) for 1, 3, and 5 days. (B) Cell cycle distribution of HUVEC under normal glucose (8 mM) and high glucose (25 mM) conditions at Day 0, Day 1, and Day 5, analyzed by flow cytometry. (C) Fluorescence microscopy images of F-actin (red), EVs (green), and nuclei (blue) in HUVEC after incubation with EV or CSEV for 24 h. Scale bar: 100 μm. (D) VEGF concentration in HUVEC treated with EVs over 3 days. (E) Tube formation assay of HUVEC treated with EVs visualized after 6 h. Scale bar: 500 μm. Quantification of branch points (F) and total tube length (G) in the tube formation assay. Data are presented as mean ± SD, and * indicates statistical significance compared to Ctl (p < 0.05), # indicates statistical significance between EV and CSEV (p < 0.05)
Fig. 6
Fig. 6
Transcriptomic and miRNA profiling of EV and CSEV. (A) Heatmap of differentially expressed genes (DEGs) between EV and CSEV. (B) Volcano plot showing upregulated (red) and downregulated (blue) genes in CSEV compared to EV. (C) KEGG pathway enrichment analysis of DEGs, highlighting key pathways involved in CSEV effects. (D) GO term enrichment analysis categorizes DEGs based on biological processes, cellular components, and molecular functions. (E) Upregulated miRNAs in CSEV associating with angiogenesis, anti-inflammation, and wound healing. Data are presented as log2 fold changes (log FC)
Fig. 7
Fig. 7
Physicochemical properties of collagen and its enhanced therapeutic potential of CSEV for wound healing. (A) FTIR spectrum of the collagen matrix showing characteristic peaks. The oscillatory rheological experiment of (B) temperature sweep and (C) strain sweep of the collagen matrix. (D) Hemolysis assay assessing the hemolytic activity of PBS, Col, EV-loaded Col (EV), and CSEV-loaded Col (CSEV), with water (H2O) as the positive control. Scale bar: 75 μm. (E) Schematic of the experimental setup for EV or CSEV encapsulated in collagen, cultured with diabetic HDF. (F) Residual weight of collagen matrix over 7 days of immersion, indicating its structural stability. (G) SEM images of the collagen matrix on Day 0 and Day 7. Scale bar is 5 μm (H) Cumulative release profile of EV and CSEV from the collagen matrix over 14 days. (I) Fluorescence microscopy images of HDF cultured on EV- or CSEV-loaded collagen at different time points (Day 0, 1, 3, and 7). Scale bar is 25 μm. (J) ROS generation in HDF cultured on collagen matrices loaded with EV or CSEV. (K) HDF proliferation on collagen matrices loaded with EV or CSEV over 7 days. Data are presented as mean ± SD, and * indicates statistical significance compared to control (Ctl) (p < 0.05), # indicates statistical significance between EV and CSEV (p < 0.05)
Fig. 8
Fig. 8
Analysis of cytokine and extracellular matrix production in cells treated with EVs. (A) Heatmap representing the secretion levels of various cytokines and growth factors, including Col I, VEGF-A, EGF, and IL-10, among others, in the CSEV, EV, and control groups. The secretion of IL-1β (B), TNF-α (C), IL-10 (D), and Collagen I (Col I) (E) in the CSEV, EV, and control groups. Data are presented as mean ± SD, and * indicates statistical significance compared to Ctl (p < 0.05), and # indicates statistical significance between EV and CSEV (p < 0.05)
Fig. 9
Fig. 9
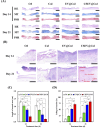
Histological evaluation of skin wound healing in diabetic rabbits treated with collagen loaded with EV or CSEV at 14- and 21-days post-surgery. HE, MT, and PSR staining were performed to assess re-epithelialization, collagen deposition, and collagen fiber organization in the control (Ctl), collagen-only (Col), EV@Col, and CSEV@Col groups. Scale bar is 500 μm. (B) Higher magnification images of HE-stained sections at 14- and 21-days post-surgery. Red arrows indicate sweat glands, capillaries, and hair follicles observed in the CSEV@Col group. Scale bar is 100 μm. Quantitative analysis of (C) the wound area length and (D) collagen fraction (%) at days 14 and 21 (n = 6). *indicates a significant difference (p < 0.05)
Fig. 10
Fig. 10
In vivo wound healing evaluation of the diabetic wound model. (A) IHC images, (B) quantification, and (C) ELISA results of CD31 at day 14 and day 21. (D) IHC images, (E) quantification, and (F) ELISA results of TNF-𝛼 at day 14 and day 21. (G) IHC images, (H) quantification, and (I) ELISA results of IL-6 at day 14 and day 21. *indicates a significant difference (p < 0.05). Scale bar is 150 μm

Similar articles

Cited by

References

    1. Tomic D, Shaw JE, Magliano DJ. The burden and risks of emerging complications of diabetes mellitus. Nat Rev Endocrinol. 2022;18:525–39. - PMC - PubMed
    1. Zhang S, Ge G, Qin Y, Li W, Dong J, Mei J, et al. Recent advances in responsive hydrogels for diabetic wound healing. Mater Today Bio. 2023;18:100508. - PMC - PubMed
    1. Louiselle AE, Niemiec SM, Zgheib C, Liechty KW. Macrophage polarization and diabetic wound healing. Transl Res. 2021;236:109–16. - PubMed
    1. Zhang Y, Luo J, Zhang Q, Deng T. Growth factors, as biological macromolecules in bioactivity enhancing of electrospun wound dressings for diabetic wound healing: a review. Int J Biol Macromol. 2021;193:205–18. - PubMed
    1. Mirhaj M, Varshosaz J, Labbaf S, Emadi R, Seifalian AM, Sharifianjazi F, et al. Mupirocin loaded core-shell pluronic-pectin-keratin nanofibers improve human keratinocytes behavior, angiogenic activity and wound healing. Int J Biol Macromol. 2023;253:126700. - PubMed

MeSH terms

LinkOut - more resources