. 2025 Jan 27;44(1):26.
doi: 10.1186/s13046-025-03295-w.

CASC8 activates the pentose phosphate pathway to inhibit disulfidptosis in pancreatic ductal adenocarcinoma though the c-Myc-GLUT1 axis

Affiliations

CASC8 activates the pentose phosphate pathway to inhibit disulfidptosis in pancreatic ductal adenocarcinoma though the c-Myc-GLUT1 axis

Hong-Fei Yao et al. J Exp Clin Cancer Res. .

Abstract

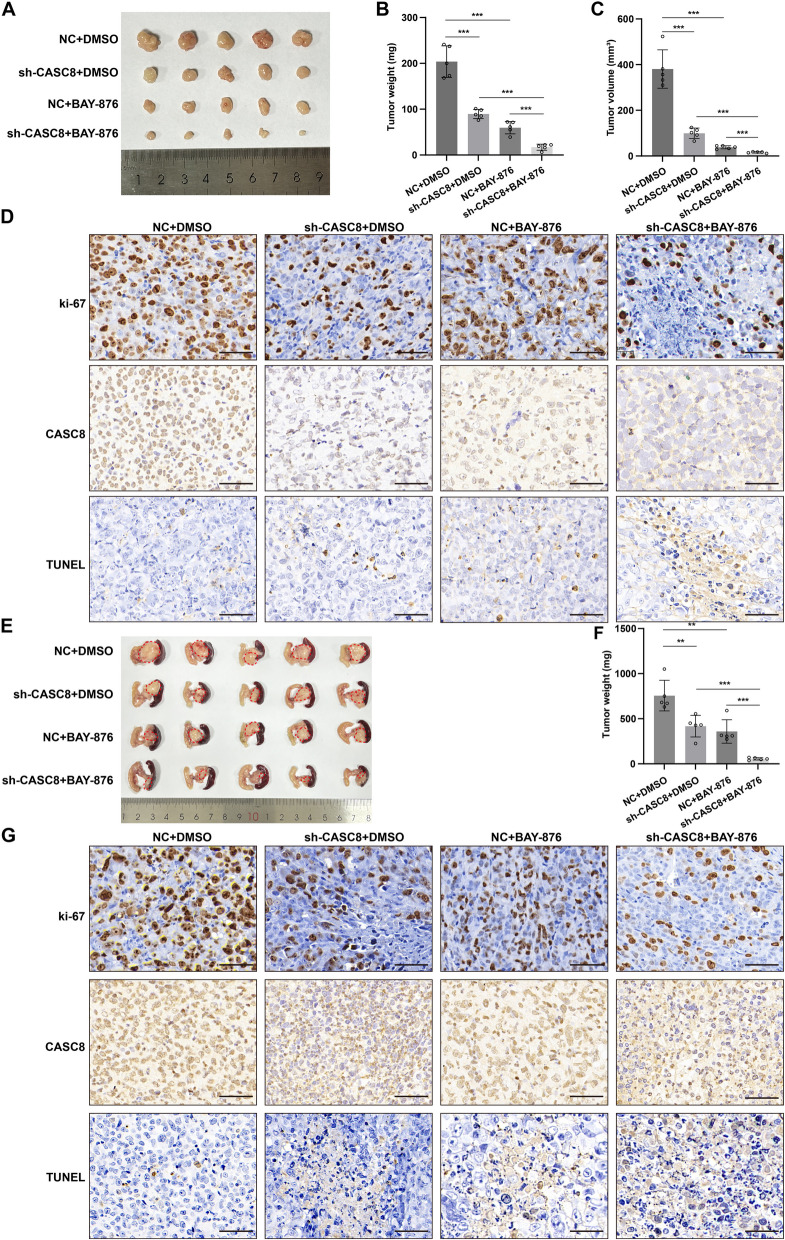
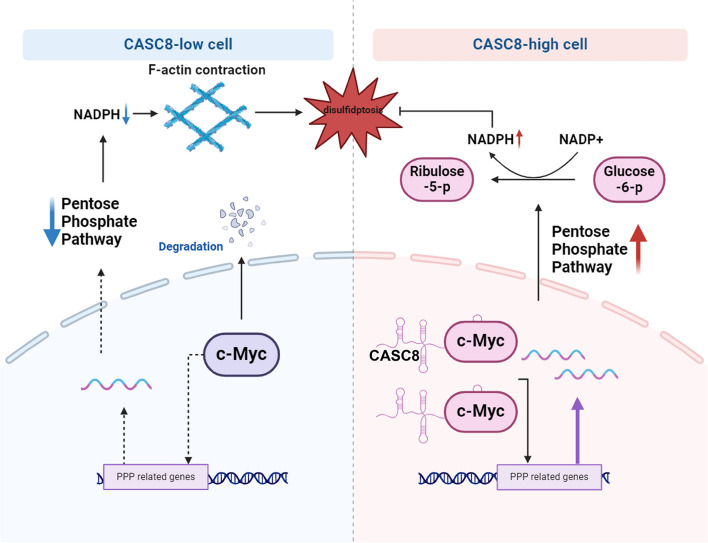
Purpose: Glucose starvation induces the accumulation of disulfides and F-actin collapse in cells with high expression of SLC7A11, a phenomenon termed disulfidptosis. This study aimed to confirm the existence of disulfidptosis in pancreatic ductal adenocarcinoma (PDAC) and elucidate the role of Cancer Susceptibility 8 (CASC8) in this process.

Methods: The existence of disulfidptosis in PDAC was assessed using flow cytometry and F-actin staining. CASC8 expression and its clinical correlations were analyzed using data from The Cancer Genome Atlas (TCGA) and further verified by chromogenic in situ hybridization assay in PDAC tissues. Cells with CASC8 knockdown and overexpression were subjected to cell viability, EdU, transwell assays, and used to establish subcutaneous and orthotopic tumor models. Disulfidptosis was detected by flow cytometry and immunofluorescence assays. RNA sequencing and metabolomics analysis were performed to determine the metabolic pathways which were significantly affected after CASC8 knockdown. We detected the glucose consumption and the NADP+/NADPH ratio to investigate alterations in metabolic profiles. RNA immunoprecipitation combined with fluorescence in situ hybridization assay was used to identify protein-RNA interactions. Protein stability, western blotting and quantitative real-time PCR assays were performed to reveal potential molecular mechanism.

Results: Disulfidptosis was observed in PDAC and could be significantly rescued by disulfidptosis inhibitors. CASC8 expression was higher in PDAC samples compared to normal pancreatic tissue. High CASC8 expression correlated with a poor prognosis for patients with PDAC and contributed to cancer progression in vitro and in vivo. Furthermore, CASC8 was associated with disulfidptosis resistance under glucose starvation conditions in PDAC. Mechanistically, CASC8 interacted with c-Myc to enhance the stability of c-Myc protein, leading to the activation of the pentose phosphate pathway, a reduction of the NADP+/NADPH ratio and ultimately inhibiting disulfidptosis under glucose starvation conditions.

Conclusions: This study provides evidence for the existence of disulfidptosis in PDAC and reveals the upregulation of CASC8 in this malignancy. Furthermore, we demonstrate that CASC8 acts as a crucial regulator of the pentose phosphate pathway and disulfidptosis, thereby promoting PDAC progression.

Keywords: Cancer susceptibility 8; Disulfidptosis; Pancreatic ductal adenocarcinoma; Pentose phosphate pathway.


Conflict of interest statement

Declarations. Ethics approval and consent to participate: All procedures related to patients were carried out in accordance with International Ethical Guidelines for Biomedical Research Involving Human Subjects (CIOMS). Consent for publication: All authors had agreed to publish this manuscript. Competing interests: The authors have declared that no conflict of interest exists.

Figures

Fig. 1
Fig. 1
The presence of disulfidptosis in PDAC. A Expression levels of DRGs in normal pancreas and pancreatic cancer. The expression data was downloaded from TCGA-PAAD and GTEx-Pancreas datasets. B Mutational information of DRGs in pancreatic cancer samples from the TCGA database. C Copy number variation of DRGs in pancreatic cancer. D Forest plot of DRGs from the results of univariate Cox regression analysis. E Correlation and prognostic values of DRGs in pancreatic cancer. F Location of DRGs in chromosomes. G The relative expression level of SLC7A11 in PDAC cell lines. H, I Proportion of PI-positive dead cells after cultured in a glucose-free medium for 12 h and treated with 0.5 mM DTT or 1 mM TCEP in PDAC cells. The results were analyzed by one-way ANOVA. J Fluorescence staining of F-actin with phalloidin in PDAC cells under glucose starvation for 12 h. Scale bar = 20 μm. ****P < 0.0001; ***P < 0.001; **P < 0.01; *P < 0.05
Fig. 2
Fig. 2
The expression level and prognostic value of CASC8 in PDAC. A The Sankey diagram showing the relationship between DRGs and DRLs. B Coefficient of five disulfidptosis-related lncRNAs in the risk signature. C The expression level of CASC8 in TCGA-PAAD and GTEx-Pancreas datasets. The statistical analysis was done by unpaired t-test. D, E Kaplan–Meier survival curve analysis of OS (D) and DFS (E) was conducted between the high and low CASC8 groups using data from TCGA. F Cell types identified by the single-cell RNA sequencing dataset CRA001160. G The expression level of CASC8 across various cell types identified by the dataset CRA001160. H Fluorescent staining of CK19 and FISH of CASC8 in normal pancreas and PDAC tissues. Scale bar = 20 μm. I CISH of CASC8 in normal pancreas, chronic pancreatitis, and PDAC tissues. ***P < 0.001; **P < 0.01; *P < 0.05
Fig. 3
Fig. 3
The roles of CASC8 in regulating disulfidptosis in PDAC. A, B The effects of CASC8 knockdown on the death of MIA PaCa-2 (A) and Patu8988 (B) after cultured in glucose-free medium for 12 h and treated with 0.5 mM DTT or 1 mM TCEP. C, D The results of statistical analysis of the PI-positive cells in MIA PaCa-2 (C) and Patu8988 (D). The statistical analyses were done by one-way ANOVA. E The effects of CASC8 overexpression on the death of SW-1990 and AsPC-1 after cultured in glucose-free medium for 12 h and treated with 0.5 mM DTT or 1 mM TCEP. F, G The results of statistical analysis of the PI-positive cells in AsPC-1 (F) and SW-1990 (G). The results were analyzed by unpaired t-test. H Fluorescent staining of F-actin with phalloidin in PDAC cells after CASC8 knockdown or overexpression. The cells were cultured under glucose starvation for 12 h. Scale bar = 20 μm. ***P < 0.001; **P < 0.01; *P < 0.05
Fig. 4
Fig. 4
CASC8 inhibits PDAC disulfidptosis in vivo. A Subcutaneous xenograft tumor growth in mice inoculated with shNC, sh-CASC8 MIA PaCa-2 (n = 5 for each group). After implanting the tumor subcutaneously for 7 days, each group of mice received intraperitoneal injections of BAY-876 at a dose of 3 mg/kg in 100 μL of 40% dimethylsulfoxide in saline (vehicle) or vehicle alone every two days. B, C Statistical analysis of tumor weight and volume of subcutaneous xenograft tumors from different groups. P-values between the two interested groups were calculated by unpaired t-test. D Representative images of IHC staining for ki-67, and CISH for CASC8, and TUNEL assay in subcutaneous xenograft tumors. Scale bar = 20 μm. E Orthotopic xenograft tumor growth in mice inoculated with shNC, sh-CASC8 MIA PaCa-2 (n = 5 for each group). After implanting the tumor orthotopically for 7 days, each group of mice received intraperitoneal injections of BAY-876 at a dose of 3 mg/kg in 100 μL of 40% dimethylsulfoxide in saline (vehicle) or vehicle alone every two days. F Statistical analysis of tumor weight of orthotopic xenograft tumors from different groups. P-values between the two interested groups were calculated by unpaired t-test. G Representative images of IHC staining for ki-67, and CISH for CASC8, and TUNEL assay in orthotopic xenograft tumors. P-values between the two interested groups were calculated by unpaired t-test. Scale bar = 20 μm. ***P < 0.001; **P < 0.01; *P < 0.05
Fig. 5
Fig. 5
CASC8 is associated with the pentose phosphate pathway in PDAC cells. A GSEA analysis of groups expressing CASC8 at high and low levels in TCGA dataset by using hallmark gene sets and KEGG gene sets. B Western blotting analysis of glycolysis-related genes after CASC8 knockdown. C Immunofluorescence staining of GLUT1 in Patu8988 and MIA PaCa-2 after CASC8 knockdown. Scale bar = 100 μm. D qPCR analysis of genes involved in phosphate pentose pathway in MIA PaCa-2 and Patu8988 after CASC8 knockdown. Statistical significances were calculated by one-way ANOVA. E qPCR analysis of genes involved in phosphate pentose pathway in SW-1990 and AsPC-1 after CASC8 overexpression. Statistical significances were calculated by unpaired t-test. F, G Relative NADP+/NADPH ratio (F) and glucose uptake (G) in Patu8988 and MIA PaCa-2 after CASC8 knockdown. Statistical significances were calculated by one-way ANOVA. H, I Relative NADP.+/NADPH ratio (H) and glucose uptake (I) in SW-1990 and AsPC-1 after CASC8 overexpression. Statistical significances were calculated by unpaired t-test. J Relative NADP⁺/NADPH ratio in cells with CASC8 knockdown under glucose starvation conditions. Statistical significances were calculated by one-way ANOVA. K Relative NADP⁺/NADPH ratio in cells with CASC8 overexpression under glucose starvation conditions. Statistical significances were calculated by unpaired t-test. L, M The levels of glycolysis metabolites (L) and the intermediates of phosphate pentose pathway (M) in MIA PaCa-2 with CASC8 knockdown under glucose starvation conditions. All metabolite levels were normalized to the control cells. Statistical significances were calculated by unpaired t-test. DHAP, dihydroxyacetone phosphate; Fru, fructose; FBP, fructose 1,6-bisphosphate; F6P, fructose 6-phosphate; G6P, glucose 6-phosphate; Lac, lactate; Pyr, pyruvate; D-Glu, D-glucose; RP, D-ribulose 5-phosphate; S7P, D-sedoheptulose 7-phosphate; GC, gluconic acid. ***P < 0.001; **P < 0.01; *P < 0.05
Fig. 6
Fig. 6
CASC8 is capable of binding to c-Myc and modulating its protein stability. A GSEA analysis of groups expressing CASC8 at high and low levels in TCGA dataset by using hallmark gene sets. B GSEA analysis between the control cells and CASC8 knockdown cells based on the results of RNA-seq by using hallmark gene sets. C RIP analysis of c-Myc binding to sequences of CASC8 with an anti-c-Myc antibody or IgG. Statistical significances were calculated by unpaired t-test. D Immunofluorescence staining of c-Myc and FISH of CASC8 in PDAC tissues. The results showed co-localization of c-Myc with CASC8 in the nucleus of cancer cells. Scale bar = 10 μm. E Immunofluorescence staining of c-Myc and FISH of CASC8 in MIA PaCa-2 and Patu8988. The results showed co-localization of c-Myc with CASC8 in the nucleus of PDAC cells. Scale bar = 20 μm. F Western blotting analysis of c-Myc after CASC8 knockdown in MIA PaCa-2 and Patu8988. G Western blotting analysis of c-Myc and GLUT1 after CASC8 knockdown in MIA PaCa-2 and Patu8988 under glucose starvation conditions. H Western blotting analysis of c-Myc after CASC8 overexpression in AsPC-1 and SW-1990. I Western blotting analysis of c-Myc and GLUT1 after CASC8 overexpression in AsPC-1 and SW-1990 under glucose starvation conditions. J Western blotting analysis of c-Myc after CASC8 knockdown and with 10 μg/mL CHX for six hours. K Determination of c-Myc stability in CASC8 knockdown and control cells incubated with 10 μg/mL CHX for six hours. L qPCR analysis of c-Myc target genes in MIA PaCa-2 and Patu8988 after CASC8 knockdown. Statistical significances were calculated by one-way ANOVA. ***P < 0.001; **P < 0.01; *P < 0.05
Fig. 7
Fig. 7
CASC8 inhibits PDAC cells disulfidptosis via c-Myc. A Western blotting analysis of c-Myc and GLUT1 following the c-Myc overexpression in CASC8 knockdown cells. B Western blotting analysis of c-Myc and GLUT1 following the c-Myc knockdown in CASC8 overexpression cells. C Relative NADP+/NADPH ratio in MIA PaCa-2 and Patu8988. CASC8 was knocked down in the cells, followed by the c-Myc overexpression. P-values between the two interested groups were calculated by unpaired t-test. D Relative NADP.+/NADPH ratio in SW-1990 and AsPC-1. CASC8 was overexpressed in the cells, followed by the c-Myc knockdown. P-values between the two interested groups were calculated by unpaired t-test. E Relative glucose uptake in MIA PaCa-2 and Patu8988. CASC8 was knocked down in the cells, followed by the c-Myc overexpression. P-values between the two interested groups were calculated by unpaired t-test. F Relative glucose uptake in SW-1990 and AsPC-1. CASC8 was overexpressed in the cells, followed by the c-Myc knockdown. P-values between the two interested groups were calculated by unpaired t-test. G The effect of c-Myc overexpression in CASC8 knockdown cells on cell death after cultured in glucose-free medium for 12 h and with or without 1 mM TCEP. H, I Statistical analysis of the PI-positive cells in MIA PaCa-2 (H) and Patu8988 (I) after CASC8 knockdown and following c-Myc overexpression. Statistical significances were calculated by one-way ANOVA. ***P < 0.001; **P < 0.01; *P < 0.05
Fig. 8
Fig. 8
CASC8 inhibits PDAC disulfidptosis via c-Myc in vivo. A Subcutaneous xenograft tumor growth in mice inoculated with shNC, sh-CASC8, or sh-CASC8 + c-Myc MIA PaCa-2 (n = 5 for each group). After implanting the tumor subcutaneously for 7 days, all mice received intraperitoneal injections of BAY-876 at a dose of 3 mg/kg in 100 μL of 40% dimethylsulfoxide in saline (vehicle) or vehicle alone every two days. B, C Statistical analysis of tumor weight and volume of subcutaneous xenograft tumors from different groups. P-values between the two interested groups were calculated by unpaired t-test. D Representative images of IHC staining for ki-67, c-Myc, and CISH for CASC8, and TUNEL assay in subcutaneous xenograft tumors. Scale bar = 20 μm. E Orthotopic xenograft tumor growth in mice inoculated with shNC, sh-CASC8, or sh-CASC8 + c-Myc MIA PaCa-2 (n = 4 for each group). After implanting the tumor orthotopically for 7 days, all mice received intraperitoneal injections of BAY-876 at a dose of 3 mg/kg in 100 μL of 40% dimethylsulfoxide in saline (vehicle) or vehicle alone every two days. F Representative images of IHC staining for Ki-67, c-Myc, and TUNEL assay in orthotopic xenograft tumors. Scale bar = 20 μm. ***P < 0.001; **P < 0.01; *P < 0.05
Fig. 9
Fig. 9
The mechanism diagram of this study. PDAC cells expressing CASC8 activate the pentose phosphate pathway to inhibit disulfidptosis in PDAC though its interaction with the c-Myc

References

    1. Siegel RL, Miller KD, Wagle NS, Jemal A. Cancer statistics, 2023. CA Cancer J Clin. 2023;73(1):17–48. - PubMed
    1. Arnold M, Abnet CC, Neale RE, Vignat J, Giovannucci EL, McGlynn KA, Bray F. Global Burden of 5 Major Types of Gastrointestinal Cancer. Gastroenterology. 2020;159(1):335-349.e315. - PMC - PubMed
    1. Wei D, Wang L, Zuo X, Maitra A, Bresalier RS. A Small Molecule with Big Impact: MRTX1133 Targets the KRASG12D Mutation in Pancreatic Cancer. Clin Cancer Res. 2024;30(4):655–62. - PMC - PubMed
    1. Sang W, Zhou Y, Chen H, Yu C, Dai L, Liu Z, Chen L, Fang Y, Ma P, Wu X, et al. Receptor-interacting Protein Kinase 2 Is an Immunotherapy Target in Pancreatic Cancer. Cancer Discov. 2024;14(2):326–47. - PubMed
    1. Zhang S, Yao HF, Li H, Su T, Jiang SH, Wang H, Zhang ZG, Dong FY, Yang Q, Yang XM. Transglutaminases are oncogenic biomarkers in human cancers and therapeutic targeting of TGM2 blocks chemoresistance and macrophage infiltration in pancreatic cancer. Cell Oncol (Dordr). 2023;46(5):1473–92. - PubMed

MeSH terms

LinkOut - more resources