. 2025 Mar;45(2):550-564.
doi: 10.1111/opo.13438. Epub 2025 Jan 24.

Longitudinal measures of peripheral optical quality in young children

Affiliations

Longitudinal measures of peripheral optical quality in young children

Fuensanta A Vera-Diaz et al. Ophthalmic Physiol Opt. 2025 Mar.

Abstract

Purpose: To assess longitudinal changes in optical quality across the periphery (horizontal meridian, 60°) in young children who are at high (HR) or low risk (LR) of developing myopia, as well as a small subgroup of children who developed myopia over a 3-year time frame.

Methods: Aberrations were measured every 6 months in 92 children with functional emmetropia at baseline. Children were classified into HR or LR based on baseline refractive error and parental myopia. Zernike polynomials were calculated for 4 mm pupils, accounting for the elliptical shape of the pupil in the periphery. Various metrics were computed, including Strehl Ratios with only high-order aberrations (HO-SR). Primary spherical aberration (SA), horizontal coma and defocus were also analysed given their relevance in emmetropisation. The areas under the image quality metrics for various regions of interest were computed.

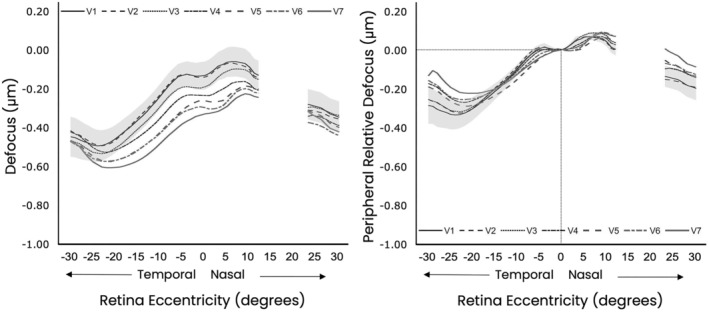
Results: HO-SR were higher in children at HR and children with myopia, even when SA was removed from the Strehl Ratio (SR) calculation. SA was less positive in children at HR and children with myopia. Defocus was more negative in children at HR and children with myopia at all eccentricities and was even more negative when computed relative to the fovea, an effect that increased in the mid periphery. Relative peripheral defocus also became more negative over time in children at HR and children with myopia at the mid temporal retina. The other aberrations showed no significant changes in time overall.

Conclusions: This longitudinal study showed differences in HO-SR, SA and defocus in the central and near-peripheral retina (±20°) of young children at HR before they develop myopia compared with children at LR for myopia. The results may indicate these eccentricities are significant in providing signals for emmetropisation. The small changes noted over time may indicate that the differences are a cause of myopia development.

Keywords: aberrations; coma; defocus; myopia; periphery.


Conflict of interest statement

None of the authors has a financial or proprietary interest in any material or method mentioned in this manuscript. Dr. Vera‐Diaz reports research support from Reality Labs Research at Meta Platform Technologies. Dr. Kerber reports research support from Essilor International, as the site‐PI for an FDA‐regulated multisite clinical trial. Dr. Bex reports personal fees as consultant for Luminopia, Neurofieldz, Novartis, and Meta. He also has personal financial interests in PerZeption and Adaptive Sensory Technology.

Figures

FIGURE 1
FIGURE 1
Image of the aberrometer's software acquisition graphical user interface (GUI) that allows the examiner to assess centration and the quality of the Shack–Hartmann spots.
FIGURE 2
FIGURE 2
Representative data from one subject for one Zernike coefficient, defocus (C0,2) across the central 60° after calculating the sliding averages. Negative and positive numbers in the X axis indicate the temporal retina (nasal field) and nasal retina (temporal field), respectively. The Y axis indicates defocus in μm. The region corresponding to the optic nerve head has been removed.
FIGURE 3
FIGURE 3
Mean values (solid lines) and 95% (shaded regions) confidence intervals (CI) for the high‐order Strehl ratio (HO‐SR) for each refractive group. Blue, yellow with black outline and red indicates low risk (LR), high risk (HR) and Myopia, respectively. 95% CIs for the myopia group were not added as they overlapped with the HR group. (a) SR with all high‐order aberrations (HOAs), (b) SR with all HOAs except primary spherical aberration (SA).
FIGURE 4
FIGURE 4
Mean values for the high‐order Strehl ratio (HO‐SR) at each visit (V1, V2, V3, V4, V5, V6 and V7) for all subjects. Grey shaded region indicates 95% confidence intervals (CI) for V1. (a) SR with all high‐order aberrations (HOAs), (b) SR with all HOAs except primary spherical aberration (SA).
FIGURE 5
FIGURE 5
Mean primary spherical aberration (SA) [C(4,0)] at each visit (V1, V2, V3, V4, V5, V6 and V7) for all subjects grouped. The grey shaded region indicates 95% confidence intervals (CI) for V1.
FIGURE 6
FIGURE 6
(a) Mean defocus [C(2,0)] values and 95% confidence intervals (CI) for each refractive group in μm. Blue, low risk (LR); yellow with black outline, high risk (HR); red, Myopia. (b) Relative peripheral defocus values. These are the same values as in (a) but now computed relative to the values at 0° (fovea). 95% CI for the myopia group were not added as they overlap with the HR group.
FIGURE 7
FIGURE 7
(a) Mean defocus [C(2,0)] values in μm at each visit (V1, V2, V3, V4, V5, V6 and V7) for all subjects grouped. (b) Relative peripheral defocus values, these are the same values as in (a) but now computed relative to the values at 0° (fovea). The grey shaded region indicates 95% confidence intervals (CI) for V1.
FIGURE 8
FIGURE 8
Mean horizontal coma [C(1,3)] values and 95% confidence intervals (CI) for each refractive group in μm. Blue, low risk (LR); yellow with black outline, high risk (HR); red, Myopia. 95% CI for the Myopia group were not added as they overlapped with the HR group.
FIGURE 9
FIGURE 9
Mean horizontal coma [C(1,3)] at each visit (V1, V2, V3, V4, V5, V6, V7) for all subjects grouped. The grey shaded region indicates the 95% confidence intervals (CI) for V1.
FIGURE 10
FIGURE 10
(a) Mean Strehl ratio (SR) for defocus [C(2,0)] values only, with 95% confidence intervals (CI) for each refractive group in μm. (b) Mean SR for defocus [C(2,0)] + primary spherical aberration (SA) [C(4,0)] values and 95% CI for each refractive group in μm. (c) Mean SR for defocus [C(2,0)] + SA [C(4,0)] + horizontal coma [C(1,3)] values and 95% CIs for each refractive group in μm. Blue, low risk (LR); yellow with black outline, high risk (HR); red, Myopia.
FIGURE 11
FIGURE 11
Mean Strehl ratio (SR) with all high‐order aberrations (HOAs) except primary spherical aberration (SA) [C(4,0)] and horizontal coma [C(1,3)] values and 95% confidence intervals (CI) for each refractive group in μm. Blue, low risk (LR); yellow with black outline, high risk (HR); red, Myopia.
FIGURE 12
FIGURE 12
Mean Strehl ratio (SR) with all monochromatic aberrations (low and high order) values and 95% confidence intervals (CI) for each refractive group in μm. Blue, low risk (LR); yellow with black outline, high risk HR; red, Myopia.
FIGURE 13
FIGURE 13
Mean and 95% confidence intervals (CI) primary spherical aberration (SA) [C(4,0)] values for each refractive group in μm. Blue, low risk (LR); yellow with black outline, high risk (HR); red, myopia. 95% CIs for the myopia group were not added as they overlapped with the HR group.

References

    1. WHO . The impact of myopia and high myopia. 2015. [cited 2024 Aug 26]. Available from: https://www.who.int/blindness/causes/MyopiaReportforWeb.pdf
    1. Holden BA, Jong M, Davis S, Wilson D, Fricke T, Resnikoff S. Nearly 1 billion myopes at risk of myopia‐related sight‐threatening conditions by 2050—time to act now. Clin Exp Optom. 2015;98:491–493. - PubMed
    1. Haarman AEG, Enthoven CA, Tideman JL, Tedja MS, Verhoeven VJM, Klaver CCW. The complications of myopia: a review and meta‐analysis. Invest Ophthalmol Vis Sci. 2020;61:49. 10.1167/iovs.61.4.49 - DOI - PMC - PubMed
    1. Mutti DO, Zadnik K. The utility of three predictors of childhood myopia: a Bayesian analysis. Vision Res. 1995;35:1345–1352. - PubMed
    1. Mutti DO, Jordan LA, Zadnik K. Predicting the onset of myopia in children: results from the CLEERE study. BMC Ophthalmol. 2021;21:279. 10.1186/s12886-021-02036-9 - DOI - PMC - PubMed