. 2025 Feb;103(2):192-212.
doi: 10.1111/imcb.12848. Epub 2025 Jan 25.

Modeling the response to interleukin-21 to inform natural killer cell immunotherapy

Affiliations

Modeling the response to interleukin-21 to inform natural killer cell immunotherapy

Indrani Nayak et al. Immunol Cell Biol. 2025 Feb.

Erratum in

Abstract

Natural killer (NK) cells are emerging agents for cancer therapy. Several different cytokines are used to generate NK cells for adoptive immunotherapy including interleukin (IL)-2, IL-12, IL-15 and IL-18 in solution, and membrane-bound IL-21. These cytokines drive NK cell activation through the integration of signal transducers and activators of transcription (STAT) and nuclear factor-kappa B (NF-κB) pathways, which overlap and synergize, making it challenging to predict optimal cytokine combinations for both proliferation and cytotoxicity. We integrated functional assays for NK cells cultured in a variety of cytokine combinations with mathematical modeling using feature selection and mechanistic regression models. Our regression model successfully predicts NK cell proliferation for different cytokine combinations and indicates synergy of activated STATs and NF-κB transcription factors between priming and post-priming phases. The use of IL-21 in solution in the priming of NK cell culture resulted in an improved NK cell proliferation, without compromising cytotoxicity potential or interferon gamma secretion against hepatocellular carcinoma cell lines. Our work provides an integrative framework for interrogating NK cell proliferation and activation for cancer immunotherapy.

Keywords: NK cells; STAT; cytokines; linear regression; predictive model; proliferation.


Conflict of interest statement

The authors declare no conflicts of interest.

Figures
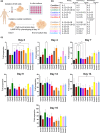
Figure 1
Figure 1
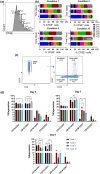
Testing different cytokine conditions for natural killer (NK) cell proliferation. (a) NK cells were isolated from the peripheral blood of 17 healthy donors and cultured with different combinations of cytokines with fresh media replenished every 2–3 days. Cells were counted at days 0, 2, 4, 7, 9, 12, 14 and 16. Lysosome‐associated membrane protein (LAMP) or CD107a and IFNγ expression were measured on day 10. (b) The different combinations of cytokines used to culture NK cells. For condition 6, interleukin (IL)‐21 boost indicates the addition of IL‐21 for 3 days of culture. IL‐21 was added on day 7 of culture, until day 10, after which the media was changed and the IL‐2 + 15 cytokine combination was used. (c) Proliferation of NK cells treated with the regimens as illustrated in (b). Ten donors were treated with conditions 1–6, 4 donors with conditions 7 and 8 and 3 donors with conditions 9–12. Data are shown as mean ± standard error of the mean (*P ≤ 0.05, **P ≤ 0.01). Data were analyzed by one‐way ANOVA and Dunnett's multiple comparison test.
Figure 2
Figure 2
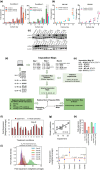
Proliferation and maturation of natural killer (NK) cell subpopulations. NK cells from 4 donors were stained with CellTrace carboxyfluorescein succinimidyl ester (CFSE); cultured with condition 1, condition 2, condition 3 and condition 12; and assessed by flow cytometry on days 5, 7 and 9 of in vitro culture. (a) Representative example of gating strategy. The whole NK cell population was gated on each cell division, according to the levels of fluorescence of CFSE. This was used to determine the size of each subpopulation, plotted in (b). (b) Proliferation of each NK subpopulation, based on their CFSE percentage. The width of each color segment reflects the proportion of the individual populations in the entire CFSE+ cell population. Each division is marked by a difference in CFSE retention by the cells, marking the different populations (pop0 to pop7) within the whole heterogenous cell pool. Data are shown as mean ± standard error of the mean (n = 4). (c) Representative example of gating strategy. CD56+ NK cells were analyzed for the expression of CD16 and CD57 by flow cytometry. (d) Proportions of NK subpopulations according to the expression of CD16 and CD57, on days 5, 7 and 9, as shown in the gating strategy in (c). Data are shown as mean ± standard error of the mean (n = 4), analyzed by two‐way ANOVA with Tukey's multiple comparison test (*P ≤ 0.05, **P ≤ 0.01, ***P ≤ 0.001, ****P ≤ 0.0001).
Figure 3
Figure 3
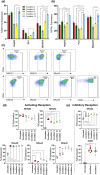
Developing and testing a model for natural killer (NK) cell proliferation: interleukin (IL)‐21 sustains early proliferation in vitro. (a, b) Isolated NK cells from three donors were cultured with the cytokine combination condition 2: IL‐12 + 15 + 18 priming for 16 h, then IL‐2 only, and condition 3: IL‐12 + 15 + 18 + 21 priming for 16 h, and then IL‐2 only. During the priming stage, NK cells were treated with either 75 μM S3I‐201 [signal transducers and activators of transcription 3 (STAT3) inhibitor] or 10 μM PS1145 [nuclear factor‐kappa B (NF‐κB) inhibitor]. Cells were then washed and cultured only with IL‐2. Data are shown as mean ± standard error of the mean. The fold expansions for the two conditions are shown in (a), and the comparisons for the two conditions are shown in (b). Data were analyzed by two‐way ANOVA and Tukey's multiple comparison test (*P ≤ 0.05, ***P ≤ 0.001, ****P ≤ 0.0001). (c) Isolated NK cells were cultured with condition 2, condition 3, or IL‐15 only (1 ng mL−1) at the indicated time points, and then pSTAT3 and pNF‐κB along with β‐actin protein levels were detected by immunoblotting. (d) Schematic depiction of the construction of the in silico predictive model for NK fold expansion for various cytokine cocktails. Multiple (n = 64) imputation maps are created based on primary and secondary stats activated by IL‐2, 12, 15, 18, 21 (Supplementary table 2). Applying a feature selection method (RRelief 27 ) on the weighted average of NK cell fold expansion (Supplementary table 1b) on day 9, we selected only six imputation maps (maps 8, 14, 16, 28, 42 and 44) based on the results obtained in inhibition experiments in (a, b). Based on these six imputation maps (Supplementary table 2), multiple linear regression models are constructed considering various interactions of activated STATs and NF‐κB between the priming and post‐priming I periods across different cytokine cocktail conditions that regulate NK cell fold expansion. To check the predictive ability of the models in estimating the weighted average of fold expansion on day 9 in response to different cytokine cocktails, leave‐one‐out cross‐validation (LOOCV) is performed by varying imputation maps and linear regression models (see the “Methods” section). The optimal imputation map and the regression model are chosen based on the minimum residual sum of squares (RSS) across 12 LOOCV test sets. (e) STAT and NF‐κB activation in the optimal imputation map (map 28) on day 9. (f) Comparison of the fold expansion between experiment (maroon) and in silico predictive model (gray) on day 9 for cytokine cocktail conditions 1‐12. The in silico regression model uses the optimal imputation map (e). (g) Comparison of the predicted weighted average of fold expansion (f) with the experimental data across 12 cytokine cocktail conditions shows good agreement (R 2 = 0.55, see the “Methods” section for the calculation of R 2). (h) Predictions of the weighted averages of fold expansion on day 9 for conditions 2 and 3 with and without the presence of STAT3 and NF‐κB inhibitors using the optimal predictive model. (i) (left) Normalized distribution of the weighted average obtained from bootstrapped samples (n = 10000) for conditions 1–6 on an imputed fold expansion data on day 8. (Right) Means of the weighted averages with blue circles with 95% confidence interval represented by orange error bars. P‐values are calculated using the permutation test for each condition within the same group of donors (D1–D10) against condition 3. The red dashed line represents the average of all blue points across cytokine conditions 1–6.
Figure 4
Figure 4
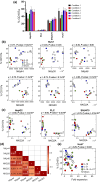
Effects of different regimens on natural killer (NK) cell receptor expression and cytotoxicity potential against hepatocellular carcinoma cell lines as a model for immunotherapy. NK cells from three donors (D15–D17) were cultured using the indicated cytokine conditions and then assayed on day 10 for cytotoxicity potential against the indicated hepatocellular carcinoma cell lines using a CD107a degranulation assay (a) or for expression of interferon gamma (IFNγ) (b). Assays were performed at an effector‐to‐target ratio of 1:1. Data were analyzed by two‐way ANOVA and Dunnett's multiple comparison test (*P ≤ 0.05, **P ≤ 0.01, ***P ≤ 0.001, ****P ≤ 0.0001). (c) Representative example of gating strategy. CD56+ NK cells were analyzed for the expression of NKG2D, NKG2C, NKp46, NKp44, NKp30, NKG2A and CD96 by flow cytometry. (d) Expression of activating receptors by NK cells stimulated by cytokines for 10 days. (e) Expression of inhibitory receptors by NK cells stimulated by cytokines for 10 days. Data are shown as mean ± standard error of the mean (n = 3), analyzed by Repeated Measures (RM) one‐way ANOVA and Dunnett's multiple comparison test (***P ≤ 0.001, ****P ≤ 0.0001). Untreated indicates freshly isolated NK cells without cytokine addition. These were analyzed by flow cytometry directly after isolation and were not kept in culture with cytokines. On day 10 of culture, cytokine‐stimulated NK cells were analyzed by flow cytometry, and their phenotype was compared with the untreated NK cells.
Figure 5
Figure 5
Correlations of cytotoxicity potential with natural killer (NK) cell proliferation and receptor expressions against different hepatocellular carcinoma cell lines. (a) %CD107a expression levels against four hepatocellular carcinoma cell lines HepG2, PLC, SNU475 and Huh7. NK cells from eight donors (D3–D10) were incubated with cytokines according to conditions 1–6 and then assayed for proliferation, CD107a and receptor expression on day 10. (b) Correlation of cytotoxicity potential (%CD107a expression) against the Huh7 cell line with mean NK cell receptor expressions for the high CD16‐expressing donors (8 donors: D5 and D6, D8–D10, D15–D17) cultured under 10 different cytokine conditions (conditions 1–6, 9–12). Each square represents a donor, labeled based on the treatment conditions in the presence of either interleukin (IL)‐18 (red) or IL‐21 (blue) or IL‐18 + 21 (green) or none of the two (gray). Pearson correlations (ρ) between %CD107a and each of mean receptor expressions are shown along with P‐values. (c) Correlation of NKG2A expression on NK cells with cytotoxicity potential for HepG2, PLC and SNU475 cell lines showing Pearson correlations (ρ) and P‐values from high CD16‐expressing donors. (d) Correlation matrix representing the correlation between the mean receptor expressions on the NK cells from high CD16‐expressing donors. Pearson correlation coefficient values are shown in each box. A darker color indicates a higher correlation (positive or negative) between the two receptor types. Boxes with white stars indicate Pearson correlation values with P < 0.05. (e) Against the Huh7 cell line, %CD107a expression from (a) was correlated with the average of NK cell fold expansion on day 9 (Figure 1c) for eight donors (D3–D10), each treated with conditions 1–6.
Figure 6
Figure 6
Covariation of the mean of percentage degranulation and interferon gamma (IFNγ) secretion against different hepatocellular carcinoma cell lines with mean fold expansion of proliferating natural killer (NK) cells under different cytokine treatment conditions. (a) Variation of mean %CD107a expressions in NK cells responding to HepG2, PLC and SNU475 cell lines on day 10 is shown against the mean fold expansion of NK proliferation on day 9 under different cytokine treatment conditions. %CD107a and %IFNγ expressions are measured in expanded NK cells that were cocultured with hepatocellular carcinoma cell lines. The fold expansions of NK cells were measured under different cytokine treatment conditions as described in the main text. Each circle represents the mean values calculated for each cytokine treatment condition, with the cytokine conditions denoted by numbers above the circles. For conditions 1–6, the averages are calculated using eight donors (D3–D10) and for conditions 9–12, the averages are calculated using three donors (D15–D17). Colors filling the symbols depict the presence of interleukin (IL)‐18 (red) or IL‐21 (blue) or both (green) or none of those (gray) in the cytokine treatment condition. The dashed lines represent the medians of the respective data. (b) Variation of mean %IFNγ expressions on day 10 in NK cells responding to HepG2, PLC and SNU475 cell lines with mean fold expansion of NK proliferation on day 9 under different cytokine treatment conditions. Each circle represents the mean values calculated for each cytokine treatment condition using three donors (D15–D17).

References

    1. Romee R, Schneider SE, Leong JW, et al. Cytokine activation induces human memory‐like NK cells. Blood 2012; 120: 4751–4760. - PMC - PubMed
    1. Becknell B, Caligiuri MA. Interleukin‐2, Interleukin‐15, and their roles in human natural killer cells. Adv Immunol 2005; 86: 209–239. - PubMed
    1. de Rham C, Ferrari‐Lacraz S, Jendly S, Schneiter G, Dayer JM, Villard J. The proinflammatory cytokines IL‐2, IL‐15 and IL‐21 modulate the repertoire of mature human natural killer cell receptors. Arthritis Res Ther 2007; 9: R125. - PMC - PubMed
    1. Klingemann HG, Martinson J. Ex vivo expansion of natural killer cells for clinical applications. Cytotherapy 2004; 6: 15–22. - PubMed
    1. Lee DA. Cellular therapy: adoptive immunotherapy with expanded natural killer cells. Immunol Rev 2019; 290: 85–99. - PubMed

MeSH terms

LinkOut - more resources