. 2025 Feb;34(2):e70027.
doi: 10.1002/pro.70027.

Insights into the flexibility of the domain-linking loop in actinobacterial coproheme decarboxylase through structures and molecular dynamics simulations

Affiliations

Insights into the flexibility of the domain-linking loop in actinobacterial coproheme decarboxylase through structures and molecular dynamics simulations

Gaurav Patil et al. Protein Sci. 2025 Feb.

Abstract

Prokaryotic heme biosynthesis in Gram-positive bacteria follows the coproporphyrin-dependent heme biosynthesis pathway. The last step in this pathway is catalyzed by the enzyme coproheme decarboxylase, which oxidatively transforms two propionate groups into vinyl groups yielding heme b. The catalytic reaction cycle of coproheme decarboxylases exhibits four different states: the apo-form, the substrate (coproheme)-bound form, a transient three-propionate intermediate form (monovinyl, monopropionate deuteroheme; MMD), and the product (heme b)-bound form. In this study, we used cryogenic electron microscopy single-particle reconstruction (cryo-EM SPR) to characterize structurally the apo and heme b-bound forms of actinobacterial coproheme decarboxylase from Corynebacterium diphtheriae. The flexible loop that connects the N-terminal and the C-terminal ferredoxin domains of coproheme decarboxylases plays an important role in interactions between the enzyme and porphyrin molecule. To understand the role of this flexible loop, we performed molecular dynamics simulations on the apo and heme b coproheme decarboxylase from Corynebacterium diphtheriae. Our results are discussed in the context of the published structural information on coproheme-bound and MMD-bound coproheme decarboxylase and with respect to the reaction mechanism. Having structural information of all four enzymatically relevant states helps in understanding structural restraints with a functional impact.

Keywords: cryo‐EM; heme biosynthesis; molecular dynamics simulations; structural biology.


Conflict of interest statement

Y.G. and D.B. are co‐founders of Ligo Analytics. Y.G. serves as the CEO of Ligo Analytics.

Figures

FIGURE 1
FIGURE 1
(a) Cryo‐EM density map of the structure of heme bCdChdC (left) and apo (right) pentamer, colored by local resolution estimation obtained with cryoSPARC and ChimeraX. (b) Gold‐standard Fourier shell correlation (FSC) curves for the cryo‐EM SPR structures. FSC cutoff value of 0.143 results in spatial frequency of 1.94 Å and 2.27 Å for (a) heme b‐CdChdC (blue) and (b) apo‐CdChdC (blue), respectively. FSC between the experimental maps and the models are represented in orange.
FIGURE 2
FIGURE 2
Comparison of overall structures of coproheme decarboxylase from Corynebacterium diphtheriae (CdChdC), upper panel. (a) Cryo‐EM structure of apo‐CdChdC protein, (b) crystal structure of coproheme‐bound CdChdC, and (c) MMD‐bound CdChdC, (d) Cryo‐EM structure of heme b‐bound CdChdC. Superimposition of experimental structures of CdChdCs, lower panel. (e) Cryo‐EM and X‐ray structures of apo‐CdChdCs (magenta, PDB ID: 8QWC), coproheme‐bound (orange, PDB ID: 6XUC), MMD‐bound (salmon, PDB ID: 6XUB), and heme b‐bound (green, PDB ID: 8QUO) were aligned such that the RMSD values of their domains are minimized. (f) Side view of superimposed single subunit of CdChdC.
FIGURE 3
FIGURE 3
B‐factor variation in CdChdCs cryo‐EM and X‐ray structures (upper panel). B‐factor cartoon putty representation of (a) apo‐CdChdC, (b) coproheme‐bound, (c) MMD‐bound, and (d) heme b‐bound protomers. Loop resolution of cryo‐EM structures (lower panel). Side view of (e) heme b‐bound CdChdC. Heme b modeled into the cryo‐EM density in the active site with the map shown as magenta mesh and (f) apo‐CdChdC subunit with the loop region (L108–I127) represented in the molecular density map (blue mesh, the contour level is 8σ). The loop is shown as sticks with carbon, nitrogen, and oxygen colored yellow, blue, and red, respectively. Also labeled are the N‐termini and C‐termini.
FIGURE 4
FIGURE 4
Active site architecture of CdChdCs. Superimposed active site residues of the cryo‐EM structure apoCdChdCs (magenta, PDB ID: 8QWC) and heme‐bound (green, PDB ID: 8QUO) represented using sticks. Heme b is shown in the center (yellow) with the two propionate groups.
FIGURE 5
FIGURE 5
MD Simulations of Corynebacterium diphtheriae coproheme decarboxylase apo protein. Superposition of frames of an 800 ns trajectory (left panel), 600 ns (center panel), and 600 ns (right panel) of the apo‐CdChdC backbone in the cartoon representation. Red represents the starting frames while blue represents the end of the trajectory. Each frame is an average of 100 frames.
FIGURE 6
FIGURE 6
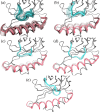
Representative structures of the five main clusters obtained from all heme b‐CdChdC complex trajectories pooled. Clusters 0 through 4 are shown in panels (a) through (e), respectively. Loop 108–127 highlighted in blue and helix 143–166 in red with the remaining backbone shown in gray. Alpha carbons of all protein subunits were fitted together to show all subunits superimposed. Average structures are shown in solid colors, while individual frames showing fluctuations are shown in transparency.
FIGURE 7
FIGURE 7
(a) Comparison of heme mobility for representative structures of cluster 0 (a) and 1 (b). Also, per residue RMSF results for loop 108–127 (c) and helix 143–166 (d), as well as per atom RMSF for the heme group (e). In (a, b) the protein backbone is depicted in ribbon representation. Loop 108–127 is shown in red, while helix 143–166 is shown in blue. Heme b group is shown in licorice representation in dark purple (average over the cluster), pink (highlighted frames), and transparent pink (frames taken every 100 representing fluctuations inside the cluster). The panels on the right show the RMSF data of cluster 0 in blue and cluster 1 in orange.
FIGURE 8
FIGURE 8
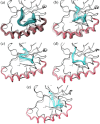
Representative structures of the five most populated clusters of apo‐CdChdC. Clusters 0 through 4 are shown in panels (a) through (e), respectively. The backbone is shown in ribbons representation with loop 108–127 highlighted in blue and helix 143–166 in red with the rest of the backbone in gray. Alpha carbons of all protein subunits were fitted together to show all subunits superimposed. Average structures are shown in solid colors, while individual frames showing fluctuations are shown in transparency.
FIGURE 9
FIGURE 9
(a) Comparison of clusters obtained for apo‐CdChdC with those of the heme bCdChdC complex. (b) RMSF per residue for apo‐CdChdC for clusters 0 and 1. Clusters 0 through 4 are shown in panels (a) through (e), respectively. Ribbon representation is used. Loop 108–127 and helix 146–166 are shown in colors cyan and red for their respective structures, while the rest of the protein is shown in gray.
FIGURE 10
FIGURE 10
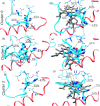
His118 conformations subclusters and populations distinguished by loop 108–127 conformation (clusterization analysis performed previously; see Figures 7, 8, 9, 10). The left panels correspond to apo‐CdChdC, while the right panels are heme bCdChdC. Loop 108–127 is shown as cyan ribbons and helix 140–160 in red ribbons. Heme is shown in gray. Residues close to His118 are shown as thin licorice and His118 as thick licorice. Populations of different His118 conformations are indicated as percentages of the total trajectory.
FIGURE 11
FIGURE 11
Porphyrin interactions. The hydrogen bond network of monovinyl monopropionate deteroheme (MMD) (left) and heme b (right) with their respective neighboring residues in the active site of CdChdC. The protein residues are depicted using the stick model, and the water is displayed as red spheres. A distinct color represents each propionate and its corresponding vinyl groups.
FIGURE 12
FIGURE 12
Contact maps of heme b propionates. Contact maps of propionate p7 (upper panels, a, b, and c) and p6 (lower panels, d, e, and f) with amino acid residues of heme‐CdChdC. Panels on the left (a, d) correspond to the loop 108–127 in the “closed” conformation (cluster 0), while those on the center (b, e) and right (c, f) correspond to the “open” conformation of loop 108–127 (clusters 1 and 2) (see Figure 6). Propionate p7 is shown in magenta in the upper panels, while p6 is shown in cyan in the lower panels. The color scheme of amino acid residues represents the probability of interaction with p6 or p7 at distances shorter than 3.5 Å, red is low, blue is high, and white is intermediate.

Similar articles

References

    1. Afonine PV, Poon BK, Read RJ, Sobolev OV, Terwilliger TC, Urzhumtsev A, et al. Real‐space refinement in PHENIX for cryo‐EM and crystallography. Acta Crystallogr D Struct Biol. 2018;74:531–544. - PMC - PubMed
    1. Berendsen HJC, Postma JPM, Van Gunsteren WF, Dinola A, Haak JR. Molecular dynamics with coupling to an external bath. J Chem Phys. 1984;81:3684–3690.
    1. Bromberg R, Guo Y, Borek D, Otwinowski Z. High‐resolution cryo‐EM reconstructions in the presence of substantial aberrations. IUCrJ. 2020;7:445–452. - PMC - PubMed
    1. Brooks CL. Computer simulation of liquids. J Solution Chem. 1989;18:99.
    1. Brown A, Long F, Nicholls RA, Toots J, Emsley P, Murshudov G. Tools for macromolecular model building and refinement into electron cryo‐microscopy reconstructions. Acta Crystallogr D Biol Crystallogr. 2015;71:136–153. - PMC - PubMed

MeSH terms

LinkOut - more resources