. 2025 Feb;45(2):e16236.
doi: 10.1111/liv.16236.

Maternal Western Diet Programmes Bile Acid Dysregulation and Hepatic Fibrosis in Fetal and Juvenile Macaques

Affiliations

Maternal Western Diet Programmes Bile Acid Dysregulation and Hepatic Fibrosis in Fetal and Juvenile Macaques

Michael J Nash et al. Liver Int. 2025 Feb.

Abstract

Background and aims: Maternal obesity increases the risk of the paediatric form of metabolic dysfunction-associated steatotic liver disease (MASLD), affecting up to 30% of youth, but the developmental origins remain poorly understood.

Methods: Using a Japanese macaque model, we investigated the impact of maternal Western-style diet (mWSD) or chow diet followed by postweaning WSD (pwWSD) or chow diet focusing on bile acid (BA) homeostasis and hepatic fibrosis in livers from third-trimester fetuses and 3-year-old juvenile offspring.

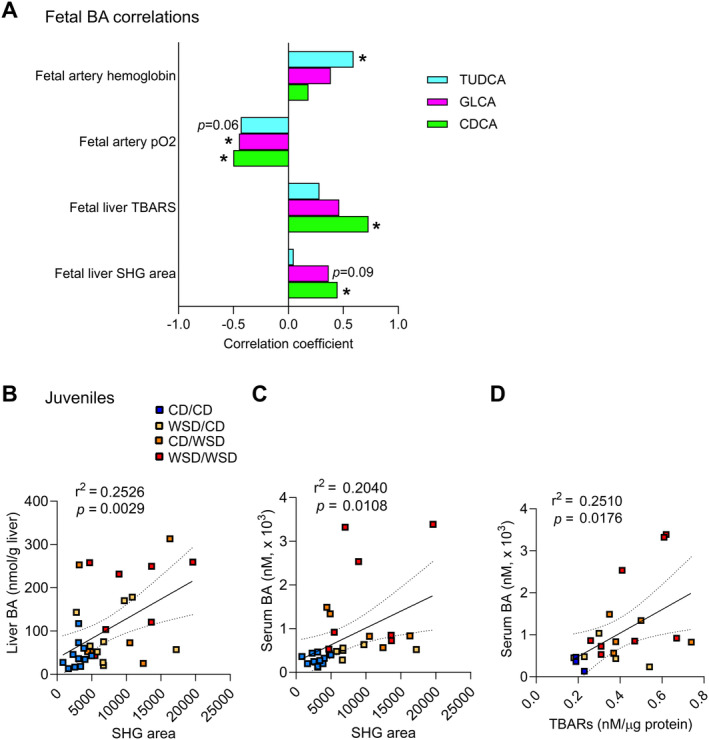
Results: Juveniles exposed to mWSD had increased hepatic collagen I/III content and stellate cell activation in portal regions. mWSD increased transcriptional signatures of FXR activation, while pwWSD impaired FXR pathway genes and increased liver BA content. Both mWSD and pwWSD increased serum BA concentrations. Notably, mWSD-exposed juvenile offspring had increased periportal CK19 expression and cholangiocyte gene expression supporting proliferation compared with maternal chow-exposed offspring. Fetuses exposed to mWSD had increased CK19 expression and hepatic BAs which correlated positively with periportal collagen deposition and negatively with markers of fetal oxygenation. In juvenile offspring, increased serum BAs correlated positively with hepatic oxidative stress and portal fibrosis without elevated liver enzymes.

Conclusions: mWSD is associated with hallmarks of paediatric MASLD including portal bile ductular reaction, portal fibrosis and dysregulated BA homeostasis. These conditions begin in utero and persist in juvenile offspring regardless of their postweaning diet. These findings implicate changes in BA metabolism that may drive developmental programming of MASLD in juvenile offspring beginning in utero.

Keywords: Farnesoid X receptor; Paediatric MASLD; cholestasis; developmental programming; liver; stellate cells.


Conflict of interest statement

The authors declare no conflicts of interest.

Figures

FIGURE 1
FIGURE 1
Maternal and postweaning WSD exposure are associated with periportal fibrosis. (A) Representative images of portal triads in picrosirius red (PSR)‐stained sections; orange represents total PSR signal (collagens I and III). (B) Polarised light PSR quantification of area of collagen I and III around portal triads from juvenile offspring. (C) Hydroxyproline content of subset of juvenile CD/CD versus WSD/CD livers. n = 6 CD/CD, n = 7 WSD/CD. **p < 0.01 by Student's t test. (D) Representative images of juvenile portal triads via RNAscope. Red arrows indicate ACTA2 + cells; blue arrows indicate TIMP1 + cells; purple arrows indicate ACTA2 and TIMP1 double‐positive cells. (E) Average numbers of ACTA2 + cells, TIMP1 + cells and ACTA2 and TIMP1 double‐positive cells per portal triad via RNAscope. (B, E) Data are represented as median from minimum to maximum. Two‐way ANOVA with effect for maternal diet (mWSD), postweaning diet (pwWSD) or interaction effect is shown and when any are significant (p < 0.1), unless noted, individual post‐test comparisons are indicated. Different letters represent differences between groups (p < 0.05). n = 5–15 CD/CD, n = 3–4 CD/WSD, n = 6–23 WSD/CD, n = 3–7 WSD/WSD.
FIGURE 2
FIGURE 2
mWSD increases BDR. (A) Representative pictures of CK19 staining in juvenile livers. (B) Ratio of CK19‐positive area relative to total tissue area, representing PT and CV regions, in livers from juvenile offspring. Data are represented as median from minimum to maximum. Two‐way ANOVA with effect for maternal diet (mWSD), postweaning diet or interaction effect (INT) is shown and when any are significant (p < 0.1), unless noted, individual post‐test comparisons are indicated. Different letters represent differences between groups (p < 0.05). n = 10–11 CD/CD, n = 6 CD/WSD, n = 10–11 WSD/CD, n = 6–7 WSD/WSD. (C) scRNA‐seq UMAP of CD/CD and WSD/CD cholangiocytes, with the three subclusters shown (subcluster 0, red; subcluster 1, green; subcluster 2, blue). n = 3 CD/CD, n = 3 WSD/CD. (D) IPA‐derived predicted pathways upregulated or downregulated in WSD/CD cholangiocytes. White dots represent other pathways detailed in Table S2. (E) IPA‐derived predicted upstream regulators upregulated or downregulated in WSD/CD cholangiocytes. Blue, negative z‐score, downregulated; red, positive z‐score, upregulated. White dots represent other regulators highlighted in Table S3.
FIGURE 3
FIGURE 3
pwWSD increases hepatic BA content in juvenile offspring. Total bile acid (BA) content (A) and conjugated and unconjugated (B) BA content in liver tissue. Data are represented as median from minimum to maximum. Two‐way ANOVA with effect for maternal diet (mWSD), postweaning diet (pwWSD) or interaction effect (INT) is shown and when any are significant (p < 0.1), unless noted, individual post‐test comparisons are indicated. Different letters represent differences between groups (p < 0.05). (C) Pie charts showing the proportion of each conjugated BA as a proportion of total conjugated BAs in livers. (D) Pie charts showing each unconjugated BA as a proportion of total unconjugated BAs in livers. (C, D) Legends show the colour corresponding to each BA. p values for two‐way ANOVA with effect for maternal (mWSD) or postweaning diet (pwWSD) and interaction effect (INT) are shown for the relative proportions of each BA. Arrows indicate directionality of change in respective diet group. n = 12 CD/CD, n = 6 CD/WSD, n = 12 WSD/CD, n = 8 WSD/WSD.
FIGURE 4
FIGURE 4
mWSD and pwWSD increase serum BA concentrations and alter BA‐associated gene expression in juvenile offspring. Total bile acid (BA) concentrations (A) and conjugated and unconjugated BA concentrations (B) in serum. (C) Pie charts showing the proportion of each BA as a proportion of total BAs in serum. Legends show the colour corresponding to each BA, and p values for two‐way ANOVA with effect for maternal (mWSD), postweaning diet (pwWSD) and interaction effect (INT) are shown. Arrows indicate directionality of change in respective group. (D) Serum FGF19 protein concentration in juvenile offspring. (E) Serum bilirubin concentration in juvenile offspring. (F) Bulk RNA‐seq heatmap showing fold change of BA metabolism and FXR signalling genes, clustered by function. Genes most relevant to FXR signalling are highlighted. *p < 0.05 vs. CD/CD via Student's t test. n = 10–16 CD/CD, n = 10–13 WSD/CD, n = 5–6 CD/WSD, n = 6–8 WSD/WSD. (A, B, D, E) Data are represented as median from minimum to maximum. p values for two‐way ANOVA with effect for maternal diet (mWSD), postweaning diet (pwWSD) or interaction effect (INT) are shown and when any are significant (p < 0.1), unless noted, individual post‐test comparisons are indicated. Different letters represent differences between groups (p < 0.05). n = 11 CD/CD, n = 5–6 CD/WSD, n = 11 WSD/CD, n = 6–8 WSD/WSD.
FIGURE 5
FIGURE 5
Maternal WSD increases BDR in fetuses and shifts the balance of fetal liver BAs. Liver content of total bile acids (BAs) (A) and conjugated and unconjugated BAs (B). (C) Content of glycine‐conjugated BAs GCDCA, GDCA and GLCA and unconjugated BAs CDCA, DCA and UDCA in fetal livers. Data are represented as median from minimum to maximum. (D) Gene expression of BA genes in fetal livers. (E) Representative images of fetal liver CK19 staining in portal triad (PT), central vein (CV) and parenchymal regions. Quantification of fetal liver CK19 staining shown as ratio of CK19‐positive area relative to total tissue area in PT + CV regions or parenchymal regions. Data are represented as median from minimum to maximum. p values for two‐way ANOVA with effect for liver region, maternal diet or interaction effect (INT) are shown. n = 10–12 CD, n = 9–12 WSD. *p < 0.05, **p < 0.01, ***p < 0.001 via unpaired Student's t test.
FIGURE 6
FIGURE 6
Correlations between fibrosis, oxidative stress and dysregulated BA signalling. (A) Correlations between variables reflecting fetal oxygenation, fibrosis and oxidative stress and fetal liver TUDCA, GLCA and CDCA concentrations. *Indicates p < 0.05 for correlations shown. n = 9–14 CD, n = 3–21 WSD fetuses. (B) Correlation of juvenile liver total bile acid (BA) concentration and juvenile portal SHG area. (C) Correlation of juvenile serum total BA concentration and juvenile portal SHG area. (D) Correlation of juvenile serum total BA concentration and juvenile liver TBARS. 95% confidence intervals are shown for correlations in juveniles. n = 3–11 CD/CD, n = 6–9 WSD/CD, n = 5–6 CD/WSD, n = 7–8 WSD/WSD juveniles.

References

    1. Mandala A., Janssen R. C., Palle S., Short K. R., and Friedman J. E., “Pediatric Non‐Alcoholic Fatty Liver Disease: Nutritional Origins and Potential Molecular Mechanisms,” Nutrients 12, no. 10 (2020): 3166, 10.3390/nu12103166. - DOI - PMC - PubMed
    1. Lee E. J., Choi M., Ahn S. B., et al., “Prevalence of Nonalcoholic Fatty Liver Disease in Pediatrics and Adolescents: A Systematic Review and Meta‐Analysis,” World Journal of Pediatrics 20, no. 6 (2024): 569–580, 10.1007/s12519-024-00814-1. - DOI - PubMed
    1. Goyal N. P. and Schwimmer J. B., “The Progression and Natural History of Pediatric Nonalcoholic Fatty Liver Disease,” Clinics in Liver Disease 20, no. 2 (2016): 325–338, 10.1016/j.cld.2015.10.003. - DOI - PMC - PubMed
    1. Cohen C. C., Francis E. C., Perng W., et al., “Exposure to Maternal Fuels During Pregnancy and Offspring Hepatic Fat in Early Childhood: The Healthy Start Study,” Pediatric Obesity 17 (2022): e12902, 10.1111/ijpo.12902. - DOI - PMC - PubMed
    1. Nash M. J., Dobrinskikh E., Janssen R. C., et al., “Maternal Western Diet Is Associated With Distinct Preclinical Pediatric NAFLD Phenotypes in Juvenile Nonhuman Primate Offspring,” Hepatology Communications 7, no. 2 (2023): e0014, 10.1097/HC9.0000000000000014. - DOI - PMC - PubMed

Substances