. 2024 Nov 28;5(2):100663.
doi: 10.1016/j.xops.2024.100663. eCollection 2025 Mar-Apr.

Automated Quantification of Retinopathy of Prematurity Stage via Ultrawidefield OCT

Affiliations

Automated Quantification of Retinopathy of Prematurity Stage via Ultrawidefield OCT

Spencer S Burt et al. Ophthalmol Sci. .

Abstract

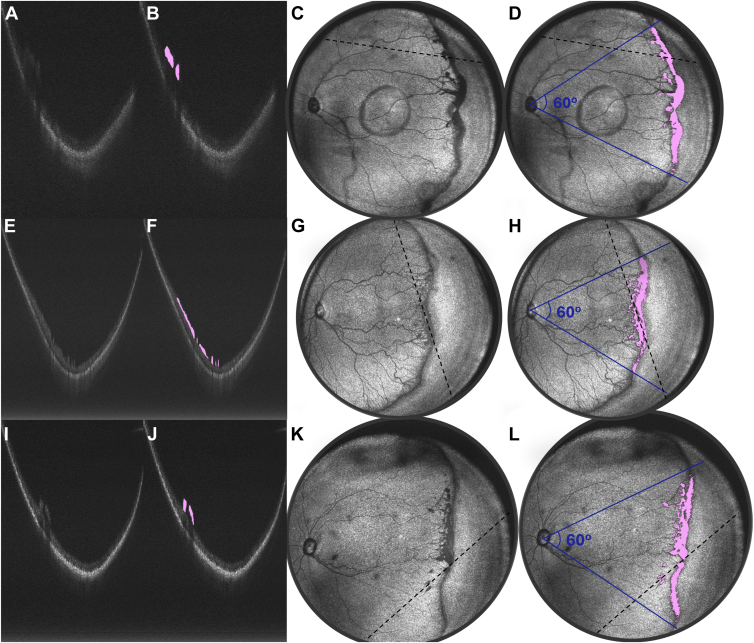
Purpose: Retinopathy of prematurity (ROP) stage is defined by the visual appearance of the vascular-avascular border, which reflects a spectrum of pathologic neurovascular tissue (NVT). Previous work demonstrated that the thickness of the ridge lesion, measured using OCT, corresponds to higher clinical diagnosis of stage. This study evaluates whether the volume of anomalous NVT (ANVTV), defined as abnormal tissue protruding from the regular contour of the retina, can be measured automatically using deep learning to develop quantitative OCT-based biomarkers in ROP.

Design: Single-center retrospective case series.

Participants: Thirty-three infants with ROP in the Oregon Health & Science University neonatal intensive care unit.

Methods: OCT B-scans were collected using an investigational ultrawidefield OCT. The ANVTV was manually segmented. A set of 3347 B-scans and corresponding manual segmentations from 12 volumes from 6 patients were used to train an automated segmentation tool using a U-Net. An additional held-out test data set of 60 B-scans from 6 infants was used to evaluate model performance. The Dice-Sorensen coefficient (DSC) comparing manual and automated segmentation of ANVTV was calculated. Scans from 21 additional infants were used for clinical evaluation of ANVTV using the visit in which they had developed their peak stage of ROP. Each infant had every B-scan in a volume automatically segmented for ANVTV (total number of segmented voxels within the 60° temporal to the optic disc). The ANVTV was compared between infants with stage 1 to 3 ROP using a Kruskal-Wallis test and tracked over time in all infants with stage 3 ROP.

Main outcome measurements: Cross sectional and longitudinal association between ANVTV and stages 1 to 3 ROP.

Results: Comparing automated and manual segmentation of ANVTV achieved a DSC of 0.61 ± 0.13. Using the U-Net, ANVTV was associated with higher disease stage both cross sectionally and longitudinally. Median ANVTV significantly increased as ROP stage worsened from 1 (0, [interquartile range: 0-0] kilovoxels) to 2 (170.1 [interquartile range: 104.2-183.6] kilovoxels) to 3 (421.4 [interquartile range: 312.3-1110.8] kilovoxels; P < 0.001).

Conclusions: Automated OCT-based measurement of ANVTV was associated with clinical disease stage in ROP, both cross sectionally and longitudinally. Ultrawidefield-OCT may facilitate more objective screening, diagnosis, and monitoring in the future.

Financial disclosures: Proprietary or commercial disclosure may be found in the Footnotes and Disclosures at the end of this article.

Keywords: Anomalous neurovascular tissue; Isolated retinal neovascularization; Optical coherence tomography; Retinopathy of prematurity; Ridge.


Figures

Figure 1
Figure 1
Sample B-scan and en face images captured using an investigational UWF-OCT device, from an infant with retinopathy of prematurity born at 24 weeks at 600 grams. This sequence of images demonstrates the process of training and utilizing a U-Net to segment and quantify 60° of anomalous ANVT, including the ridge and isolated retinal neovascularization (IRNV). (A) is a cross sectional slice of an UWF-OCT-volume with the components of ANVT, ridge and IRNV, denoted by blue and purple arrows, respectively. All subsequent B-scan slices in this figure are the same slice. (B) is an example of a manual segmentation of ANVT, pictured in pink. These manual segmentations were used to train a U-Net to automatically segment ANVT. (C) is an example of a U-Net derived segmentation of ANVT, pictured in blue. (D) is an en face image, generated using maximum intensity projections of the B-scan shown in the cross sectional images, which shows how the ANVT was visually identified using en face UWF-OCT generated images. (E) shows how 60° of temporal ANVT were selected for using the en face image. The highlighted area in orange was then projected through the B-scan to identify the 60° of interest for ANVT volume quantification. The dotted line on (E) corresponds to the plane of the B-scan slice shown in (F), with the orange highlight from (E) projected through the slice, illustrating how the 60° of temporal ANVT was selected for when calculating total ANVT volume. This technique was also used to verify the correct locations of manual segmentations during model training. ANVT = anomalous neurovascular tissue; IRNV = isolated retinal neovascularization; UWF-OCT = ultrawidefield OCT.
Figure 2
Figure 2
Sample B-scans and en face images from infants with retinopathy of prematurity that were captured using an investigational UWF-OCT device. En face images have been rotated for consistent alignment. Top row images (A–D) are from an infant at stage 3, born at 25 weeks at 795 grams. Middle-row images (E–H) are from an infant at stage 2, born at 24 weeks at 568 grams. Bottom row images (I–L) are from an infant at stage 3, born at 25 weeks at 580 grams. The 2 leftmost images in each row are the same B-scan slice, with the second image having automated U-Net segmentations of the ANVT displayed in pink. The B-scan slices are denoted by dotted lines on the final 2 images in each row, which are en face images generated using MIPs of the full UWF-OCT volume. On the final en face image in each row the U-Net segmentations from 60° of temporal ANVT have been projected using MIPs to demonstrate the U-Net performance. ANVT = anomalous neurovascular tissue; MIP = maximum intensity projection; UWF-OCT = ultrawidefield OCT.
Figure 3
Figure 3
Box plot comparing ANVTV in 60° of temporal retina in 21 infants with a maximum of stage 1 (8 infants), 2 (7 infants) and 3 (6 infants) ROP. Anomalous neurovascular tissue volume from 1 ultrawidefield OCT scan was used for each infant. Boxes represent the IQR of ANVTVs. The line inside each box identifies the median ANVTV. Whiskers extend from the IQR to encompass the maximum and minimum values within 1.5 times the IQR, whereas circles represent the data outside this range. ANVTV increased with increasing max stage ROP. ANVTV = anomalous neurovascular tissue volume; IQR = interquartile range; ROP = retinopathy of prematurity.
Figure 4
Figure 4
Line plot demonstrating longitudinal ANVTV in the 10 infants who reached stage 3 ROP included in this study. Anomalous neurovascular tissue volume was quantified in the same temporal 60° of retina across every scan for each infant. The number of plotted volumes for each infant was limited by the number of scans with appropriately oriented and quantifiable temporal neurovascular tissue. Increasing size of circle denotes increasing stage ROP, with the largest circle denoting stage 3. Pluses represent weeks where infants were stage 3 and received treatment. Infants reached their maximum stage and required treatments at different times but demonstrated a similar rise then fall of ANVTV during the course of their disease. ANVTV = anomalous neurovascular tissue volume; ROP = retinopathy of prematurity.

References

    1. Chiang M.F., Quinn G.E., Fielder A.R., et al. International Classification of Retinopathy of Prematurity, Third Edition. Ophthalmology. 2021;128:e51–e68. - PMC - PubMed
    1. Gschließer A., Stifter E., Neumayer T., et al. Inter-expert and intra-expert agreement on the diagnosis and treatment of retinopathy of prematurity. Am J Ophthalmol. 2015;160:553–560.e3. - PubMed
    1. Campbell J.P., Chiang M.F., Chen J.S., et al. Artificial intelligence for retinopathy of prematurity: validation of a vascular severity scale against international expert diagnosis. Ophthalmology. 2022;129:e69–e76. - PMC - PubMed
    1. Foos R.Y. Retinopathy of prematurity. Pathologic correlation of clinical stages. Retina. 1987;7:260–276. - PubMed
    1. Sun Y., Dalal R., Gariano R.F. Cellular composition of the ridge in retinopathy of prematurity. Arch Ophthalmol. 2010;128:638–641. - PubMed

LinkOut - more resources