. 2025 Jan 3;11(1):e41635.
doi: 10.1016/j.heliyon.2025.e41635. eCollection 2025 Jan 15.

Clusterin induced by OPC phagocytosis blocks IL-9 secretion to inhibit myelination in a model of Alzheimer's disease

Affiliations

Clusterin induced by OPC phagocytosis blocks IL-9 secretion to inhibit myelination in a model of Alzheimer's disease

Rebecca M Beiter et al. Heliyon. .

Abstract

Background: Variants in the CLUSTERIN gene have been identified as a risk factor for late-onset Alzheimer's disease and are linked to decreased white matter integrity in healthy adults. However, the specific role for clusterin in myelin maintenance in the context of Alzheimer's disease remains unclear.

Methods: We employed a combination of immunofluorescence and transmission electron microscopy techniques, primary culture of OPCs, and an animal model of Alzheimer's disease.

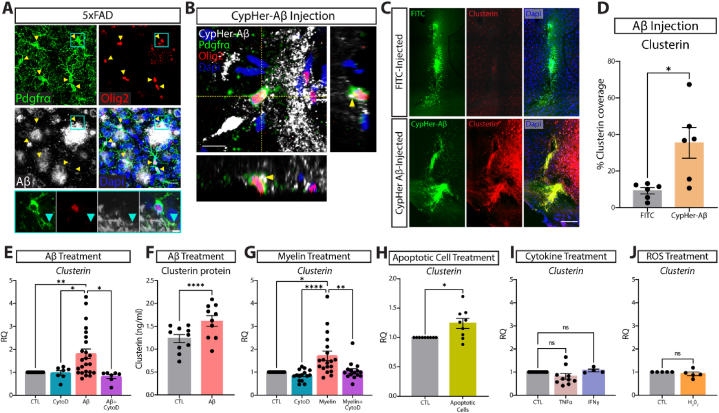
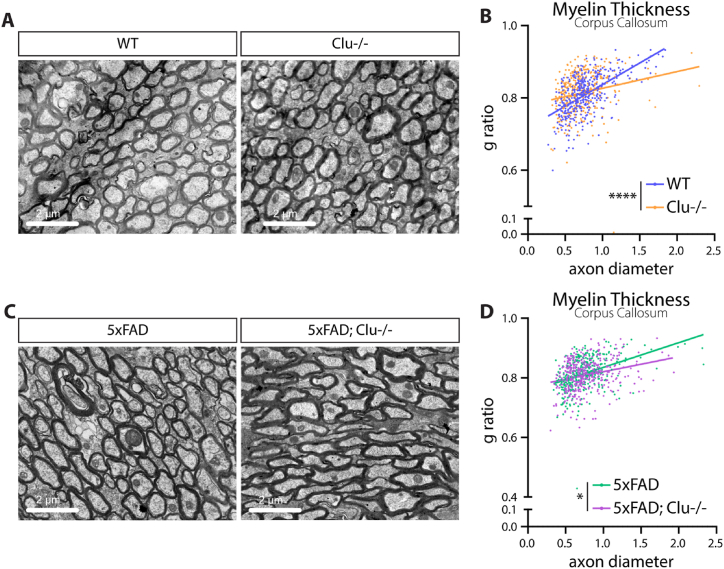
Results: We found that phagocytosis of debris such as amyloid beta, myelin, and apoptotic cells, increases clusterin expression in oligodendrocyte progenitors. We further discovered that exposure to clusterin inhibits differentiation of oligodendrocyte progenitors. Mechanistically, clusterin blunts production of IL-9 and addition of exogenous IL-9 can rescue clusterin-inhibited myelination. Lastly, we demonstrate that clusterin deletion in mice prevents myelin loss in the 5XFAD model.

Discussion: Our data suggest that clusterin could play a key role in Alzheimer's disease myelin pathology.

Keywords: Alzheimer's disease; Astrocyte; Clusterin; IL-9; Myelin; Oligodendrocyte progenitor cells.


Conflict of interest statement

The authors declare that they have no known competing financial interests or personal relationships that could have appeared to influence the work reported in this paper.

Figures

Fig. 1
Fig. 1
OPCs express the AD-risk factor clusterin. A, Representative image of Clusterin expression (immunohistochemistry, brown) in the cortex from a normal aging patient and a late-stage AD patient B, Quantification of clusterin coverage in the cortex of normal aging (n = 15) and AD patients (n = 26, from two independent experiments, depicted in A). Data analyzed using an unpaired t-test; t(39) = 3.767. C, Detection of clusterin RNA (in situ hybridization, red) and Aβ protein (immunohistochemistry, brown) in late-stage AD brain (late-stage AD n = 2; from two independent experiment). Arrowheads indicate clusterin-expressing cells around plaques. D, Representative images of clusterin expression (white) in the cortex and hippocampus of WT and 5xFAD mice. Scale bar = 30 μm. E, Quantification of clusterin coverage in the cortex and hippocampus of WT and 5xFAD mice (depicted in C; WT n = 6, 5xFAD n = 6; from two independent experiments). Statistics calculated using an unpaired Student's t-test. Cortex: t(10) = 5.049; Hippocampus: t(10) = 3.119. F, In situ hybridization for OPCs (PDGFRA in green, OLIG2 in white) expressing Clusterin (CLU; red) in normal aging and late-stage AD brains (Dashed circles mark the nucleus, normal aging n = 1, late-stage AD n = 1; from one independent experiment). Scale bar = 10 μm. G, Representative images of clusterin expression (red) in OPCs (Pdgfrα; green and Olig2; white) in the cortex and hippocampus of WT and 5xFAD mice. Colocalization of Pdgfrα and clusterin depicted in black on a white background. Scale bar = 20 μm. H, quantification of the percentage of Pdgfrα that colocalizes with clusterin in the cortex and hippocampus of WT and 5xFAD mice (depicted in G; WT n = 9, 5xFAD n = 9; from two independent experiments). Statistics calculated using an unpaired Student's t-test. Cortex: t(16) = 2.761; Hippocampus: t(16) = 3.765.
Fig. 2
Fig. 2
Phagocytosis of extracellular debris drives clusterin expression in OPCs. A, Representative image of OPCs (PDGFRα in green, Olig2 in red) surrounding Aβ plaques (white). Yellow arrowheads indicate OPCs that are extending processes into areas of Aβ accumulation. Inset is a single z-plane from main image. Teal arrow represents Aβ colocalizing with the process of a peri-plaque OPC (n = 4 mice; from one independent experiment). Scale bar = 20 μm for main image, 5 μm for inset. B, Representative orthogonal view of CyPher-labeled Aβ (white) inside an OPC (PDGFRα in green, Olig2 in red) following intra-parenchymal injection of Aβ (n = 6 mice; from one independent experiment). Yellow arrowheads indicate Aβ that can be seen inside the cell body of an OPC. Scale bar = 10 μm. C, Representative images of clusterin expression (red) in the ipsilateral (CypHer-Aβ injected; green) and contralateral (FITC injected; green) hemispheres following intra-parenchymal injection. Scale bar = 100 μm. D, Quantification of clusterin expression in the ipsilateral (Aβ-injected) and contralateral (FITC-injected) hemispheres following intra-parenchymal injection. (n = 6 mice). Statistics calculated using a paired Student's t-test; t(5) = 2.979. E, qPCR analysis of clusterin expression in OPCs following a 4-h in vitro treatment with 3 μm Aβ and the phagocytosis blocker CytoD (1 μm) or vehicle control (CTL n = 24, CytoD n = 7, Aβ n = 24, Aβ+CytoD n = 7; from seven independent experiments). Statistics calculated using a mixed effects analysis with a Tukey's post-hoc analysis; F(1.121, 13.08) = 8.544. F, Quantification by ELISA of clusterin protein in OPCs following 72-h treatment with 3 μM Aβ or vehicle control (CTL n = 10, Aβ n = 10, from two independent experiments). Statistics calculated using a paired Student's t-test; t(9) = 7.596. G, qPCR analysis of clusterin expression in OPCs following a 4-h in vitro treatment with 100 μg/ml myelin and CytoD (1 μm) or vehicle control (CTL n = 19, CytoD n = 15, Myelin n = 19, Myelin + CytoD n = 15; from five independent experiments). Statistics calculated using a mixed effects analysis with a Tukey's post-hoc analysis; F (1.389, 21.29) = 10.75. H, qPCR analysis of clusterin expression in OPCs following a 6-h in vitro treatment with apoptotic cells (CTL n = 9, Apoptotic cells n = 9; from two independent experiments). Statistics calculated using a paired Student's t-test; t(8) = 2.835. I, qPCR analysis of clusterin expression in OPCs following a 3-h in vitro treatment with 10 ng/ml TNFα or 10 ng/ml IFNγ (CTL n = 10, TNFα n = 10, IFNγ n = 4; from 2 independent TNFα experiments or 1 independent IFNγ experiment). Statistics calculated using a mixed effects analysis; F (1.106, 11.61) = 1.897. J, qPCR analysis of clusterin expression in OPCs following a 3-h in vitro treatment with 10 μm H202 (n = 5; from one independent experiment). Statistics calculated using a paired Student's t-test; t(8) = 0.3417. ∗p < 0.05, ∗∗p < 0.01, ∗∗∗∗p < 0.0001, ns = not significant. All error bars represent SEM.
Fig. 3
Fig. 3
Clusterin does not alter OPC phagocytosis of oligomeric Aβ. A, Representative flow gating (following singlets/singlets/live gates) of OPCs incubated for 90 min with 3 μm CypHer5e-labeled Aβ oligomers (all conditions) with the addition of 8 μg/ml clusterin or 1 μm CytoD (Vehicle n = 3, Clusterin n = 3, CytoD n = 3; from one independent experiment). CypHer + gate was drawn so that less than 1 % of cells in the CytoD samples fell within the positive gate. B, Quantification of OPCs staining positive for CypHer-Aβ as depicted in A. Statistics calculated using a repeated measures one-way ANOVA with a Tukey's post-hoc analysis; F(2,4) = 293.3. ∗∗p < 0.01. All error bars represent SEM.
Fig. 4
Fig. 4
Exogenous clusterin inhibits OPC differentiation. Expression of Mbp (A), Plp1 (B), Cnp (C), and Myrf (D), measured by qPCR in OPCs cultured in proliferation media (OPC Vehicle), differentiation media (OLG Vehicle), or differentiation media supplemented with 8 μg/ml of clusterin (OLG Clusterin) for 72 h (n = 7 for all conditions; from 3 independent experiments). Statistics calculated using a repeated measures one-way ANOVA with a Tukey's post-hoc analysis; Mbp F(2,6) = 27.41, Plp1 F(2,6) = 25.72, Cnp F(2,6) = 9.776, Myrf F(2,6) = 16.41. E, Representative images of OPCs cultured in differentiation media with or without 8 μg/ml of clusterin for 72 h and stained for oligodendrocyte markers (MBP in green, Olig2 in red). Scale bar = 50 μm. F, Quantification of the number of OPCs that differentiated in to oligodendrocytes following treatment with clusterin (depicted in E; n = 5 for all conditions; from two independent experiments). Statistics calculated using a paired Student's t-test; t(4) = 2.780. G, Quantification of the number of OPCs present using a Cell Counting Kit-8 assay following a 72 h incubation in proliferation media with or without 8 μg/ml clusterin (n = 11 for all conditions; from four independent experiments). ∗p < 0.05, ∗∗p < 0.01, ∗∗∗∗p < 0.0001, ns = not significant. All error bars represent SEM.
Fig. 5
Fig. 5
Clusterin inhibits OPCs differentiation by blocking IL-9 production. A, Quantification of cytokines present in the supernatant from OPCs treated with 8 μg/mL clusterin or vehicle control (n = 6 biological replicates for each condition, from two independent experiments). Data analyzed using a two-way repeated measures ANOVA with a Sidak's multiple comparison post-hoc analysis, F (6, 34) = 23.93. Expression of Mbp (B), Plp1 (C), and Myrf (D), measured by qPCR in OPCs cultured in proliferation media (OPC Vehicle), differentiation media (OLG Vehicle), differentiation media supplemented with 8 μg/ml of clusterin (OLG CLU), differentiation media supplemented with 100 ng/ml IL-9 (OLG IL-9), or differentiation media supplemented with 8 μg/ml of clusterin and 100 ng/ml IL-9 (OLG CLU + IL-9) for 72 h (n = 11 for all conditions; from 3 independent experiments). Statistics calculated using a repeated measures one-way ANOVA with a Tukey's post-hoc analysis; Mbp F(10,40) = 10.15, Plp1 F(10,40) = 11.96, Myrf F(10,40) = 10.32. ∗p < 0.05, ∗∗p < 0.01, ∗∗∗∗p < 0.0001, ns = not significant. All error bars represent SEM.
Fig. 6
Fig. 6
Deletion of clusterin improves myelination in WT and 5XFAD mice. A, Representative electron microscopy images of myelinated axons from the corpus callosum of 9-month old WT and clusterin knockout (Clu−/−) mice. B, Quantification of the myelin g-ratio plotted against axon diameter in WT and Clu−/− mice. Lines represent linear regression of the plotted data and p-values represent comparison of slopes. C, Representative electron microscopy images of myelinated axons from the corpus callosum of 9-month old 5xFAD and 5xFAD; Clu−/− mice. D, Quantification of the myelin g-ratio plotted against axon diameter in 5xFAD and 5xFAD; Clu−/− mice. Lines represent linear regression of the plotted data and p-values represent comparison of slopes. ∗p < 0.05, ∗∗∗∗p < 0.0001.

References

    1. Ackley S.F., Zimmerman S.C., Brenowitz W.D., Tchetgen Tchetgen E.J., Gold A.L., Manly J.J., Mayeda E.R., Filshtein T.J., Power M.C., Elahi F.M., et al. Effect of reductions in amyloid levels on cognitive change in randomized trials: instrumental variable meta-analysis. BMJ. 2021 doi: 10.1136/bmj.n156. - DOI - PMC - PubMed
    1. Association As 2021 Alzheimer's disease facts and figures. Alzheimer's Dementia. 2021;17:327–406. doi: 10.1002/alz.12328. - DOI - PubMed
    1. Axline S.G., Reaven E.P. Inhibition of phagocytosis and plasma membrane mobility of the cultivated macrophage by cytochalasin B. Role of subplasmalemmal microfilaments. J. Cell Biol. 1974;62:647–659. doi: 10.1083/jcb.62.3.647. - DOI - PMC - PubMed
    1. Bartl M.M., Luckenbach T., Bergner O., Ullrich O., Koch-Brandt C. Multiple receptors mediate apoJ-dependent clearance of cellular debris into nonprofessional phagocytes. Exp. Cell Res. 2001;271:130–141. doi: 10.1006/excr.2001.5358. - DOI - PubMed
    1. Beiter R.M., Rivet-Noor C., Merchak A.R., Bai R., Johanson D.M., Slogar E., Sol-Church K., Overall C.C., Gaultier A. Evidence for oligodendrocyte progenitor cell heterogeneity in the adult mouse brain. Sci. Rep. 2022;12 doi: 10.1038/s41598-022-17081-7. - DOI - PMC - PubMed

LinkOut - more resources