. 2025 Jan 6;11(1):e41581.
doi: 10.1016/j.heliyon.2024.e41581. eCollection 2025 Jan 15.

Experience-based food insecurity in Bangladesh: Evidence from Household Income and Expenditure Survey 2022

Affiliations

Experience-based food insecurity in Bangladesh: Evidence from Household Income and Expenditure Survey 2022

Faria Rauf Ria et al. Heliyon. .

Abstract

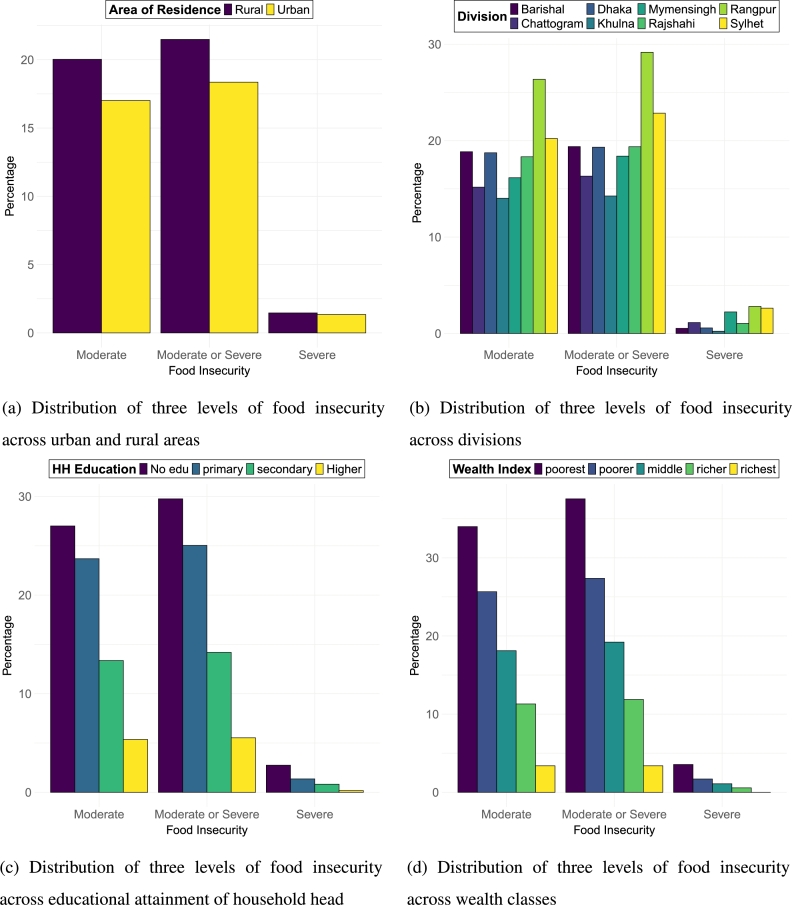
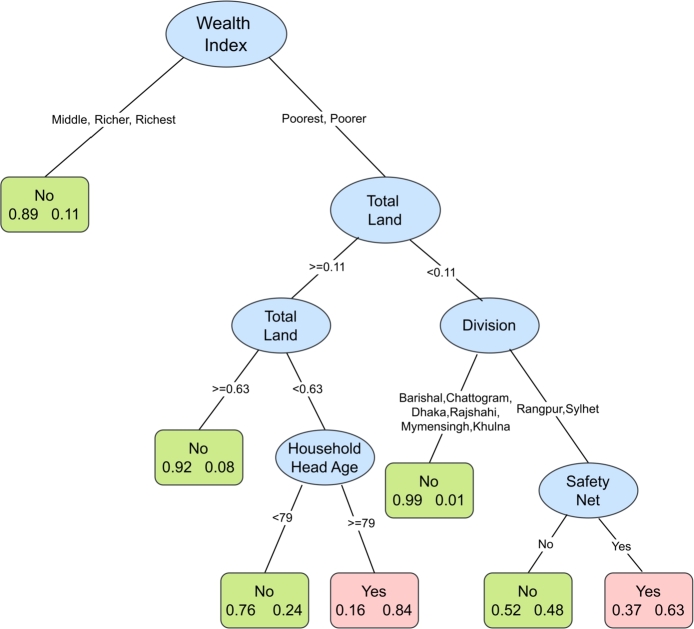
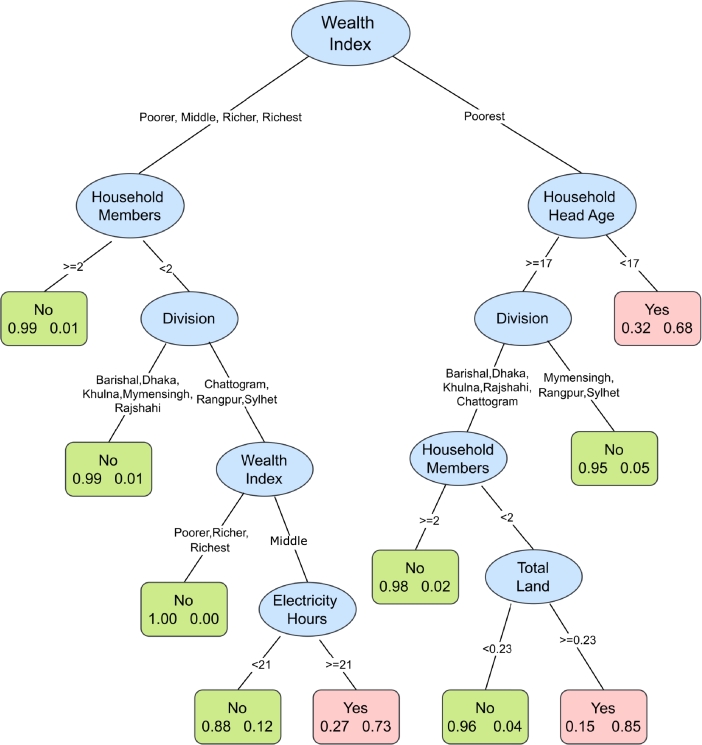
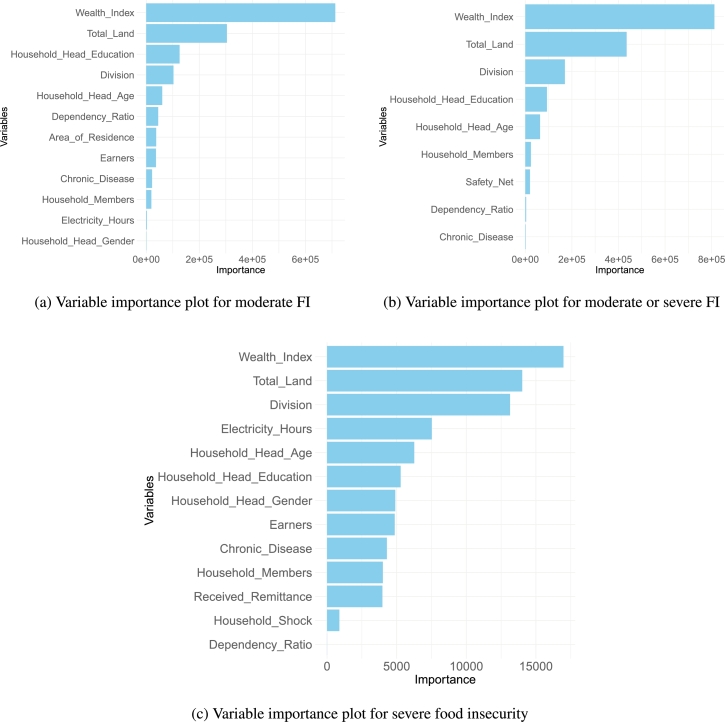
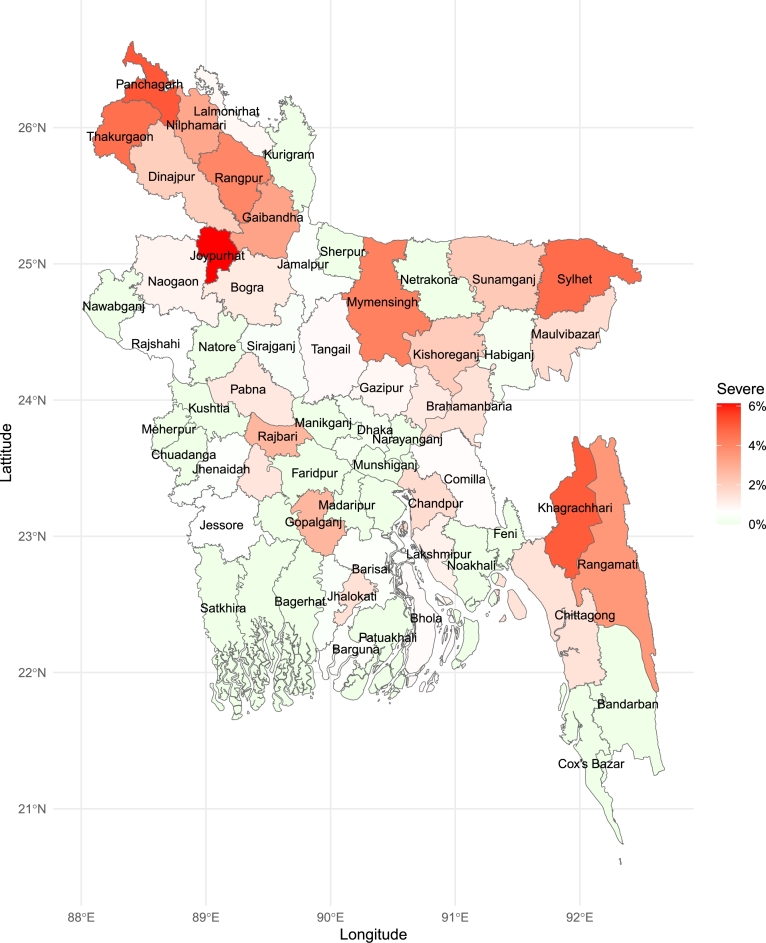
This paper examines the current state of food insecurity in Bangladesh and its socio-economic drivers using data from the latest Household Income and Expenditure Survey (HIES 2022). Unlike previous studies that relied on less precise measures of food insecurity, such as food expenditure, diversity, and calorie intake, this study employs the internationally recognized Food Insecurity Experience Scale (FIES) and Rasch model-based thresholds to classify households as food secure or insecure. Multilevel logistic regression is used to identify significant predictors of moderate and severe food insecurity, considering the hierarchical structure of the data, with households nested within geographical clusters. Key factors found to be significantly associated with food security include the wealth index, land ownership, education of the household head, family size, remittance income and exposure to shocks. A classification tree, a popular machine learning method, is also applied to explore important interactions among these determinants. The tree analysis confirms the importance of several regression-based predictors and identifies households at the highest risk of food insecurity through variable interactions. Factors such as poverty, lack of land ownership, low education levels, and high dependency ratios collectively increase a household's vulnerability to moderate food insecurity to around 51% while the national prevalence is 19%. District-level maps of food insecurity prevalence reveal significant regional disparities, underscoring the need for targeted, district-specific interventions to effectively combat food insecurity. More broadly, policies promoting education and family planning, training in better shock management, and facilitating remittance flows through simplified processes may contribute to addressing the food insecurity challenge.

Keywords: Bangladesh; Classification tree; Food insecurity; Food insecurity experience scale; Multilevel logistic regression; Rasch model; Variable importance.


Conflict of interest statement

The authors declare that they have no known competing financial interests or personal relationships that could have appeared to influence the work reported in this paper.

Figures

Figure 1
Figure 1
Distribution of food insecurity across various socio-economic dimensions: (a) Distribution of three levels of food insecurity between urban and rural areas. (b) Distribution of three levels of food insecurity across different divisions. (c) Distribution of three levels of food insecurity based on the educational attainment of the household head. (d) Distribution of three levels of food insecurity among different wealth classes.
Figure 2
Figure 2
Classification tree for moderate food insecurity. The tree includes factors predicting moderate food insecurity. The higher the variable appears in the tree structure the more statistically important the variable is. Each box at the terminal node contains two numbers: that on the left indicates percentage food secure and that on the right indicates percentage food insecure. If percentage insecure is higher than percentage secure, the group is predicted as food insecure (Yes) and the box is colored pink. Otherwise, it is predicted as food secure and colored green.
Figure 3
Figure 3
Classification tree for moderate or severe food insecurity. The tree includes factors predicting moderate to severe food insecurity. The higher the variable appears in the tree structure the more statistically important the variable is. Each box at the terminal node contains two numbers: that on the left indicates percentage food secure and that on the right indicates percentage food insecure. If percentage insecure is higher than percentage secure, the group is predicted as food insecure (Yes) and the box is colored pink. Otherwise, it is predicted as food secure and colored green.
Figure 4
Figure 4
Classification tree for severe food insecurity. The tree includes factors predicting severe food insecurity. The higher the variable appears in the tree structure the more statistically important the variable is. Each box at the terminal node contains two numbers: that on the left indicates percentage food secure and that on the right indicates percentage food insecure. If percentage insecure is higher than percentage secure, the group is predicted as food insecure (Yes) and the box is colored pink. Otherwise, it is predicted as food secure and colored green.
Figure 5
Figure 5
Variable importance plots for three levels of food insecurity: (a) Highlighting key variables contributing to the likelihood of moderate FI. (b) Showing the most significant predictors for moderate or severe FI. (c) Identifying critical variables driving severe FI.
Figure 6
Figure 6
Prevalence of moderate food insecurity across districts in Bangladesh: The choropleth map highlights the geographic distribution of moderate food insecurity, identifying districts with higher prevalence.
Figure 7
Figure 7
Prevalence of severe food insecurity across districts in Bangladesh: The choropleth map highlights the geographic distribution of severe food insecurity, identifying districts with higher prevalence.

Similar articles

References

    1. UN, Transforming our world: the 2030 agenda for sustainable development, United Nations: New York, NY, USA, 2015.
    1. FAO, IFAD, UNICEF, WFP, WHO . Food & Agriculture Org; 2023. The State of Food Security and Nutrition in the World 2023: Urbanization, Agrifood Systems Transformation and Healthy Diets Across the Rural–Urban Continuum, vol. 2023.
    1. Smith C., Parnell W.R., Brown R.C., Gray A.R. Providing additional money to food-insecure households and its effect on food expenditure: a randomized controlled trial. Public Health Nutr. 2013;16(8):1507–1515. - PMC - PubMed
    1. Hasan S.T., Hossain D., Ahmed F., Khan M.A., Begum F., Ahmed T. Association of household food insecurity with nutritional status and mental health of pregnant women in rural Bangladesh. Nutrients. 2021;13(12):4303. - PMC - PubMed
    1. Avery A. Food insecurity and malnutrition. Komp. Nutr. Diet. 2021;1(2):41–43.

LinkOut - more resources