. 2025;9(1):111-127.
doi: 10.1038/s41550-024-02386-6. Epub 2024 Nov 26.

Multiwavelength constraints on the origin of a nearby repeating fast radio burst source in a globular cluster

Affiliations

Multiwavelength constraints on the origin of a nearby repeating fast radio burst source in a globular cluster

Aaron B Pearlman et al. Nat Astron. 2025.

Abstract

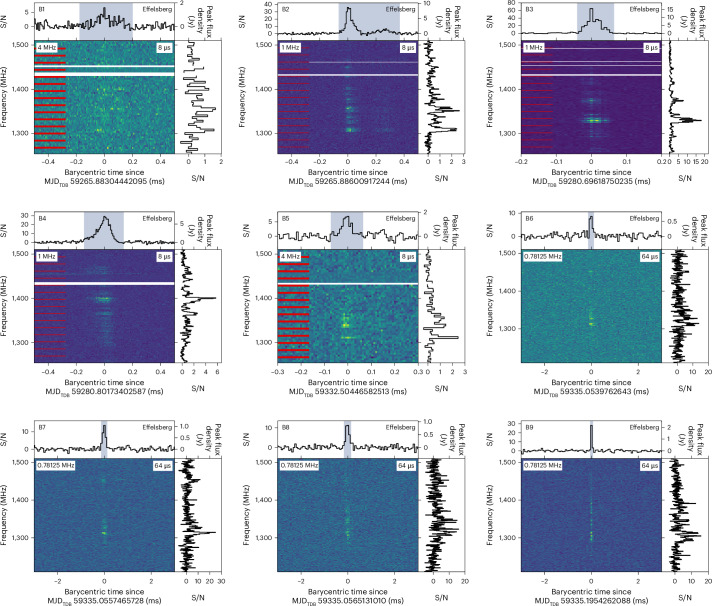
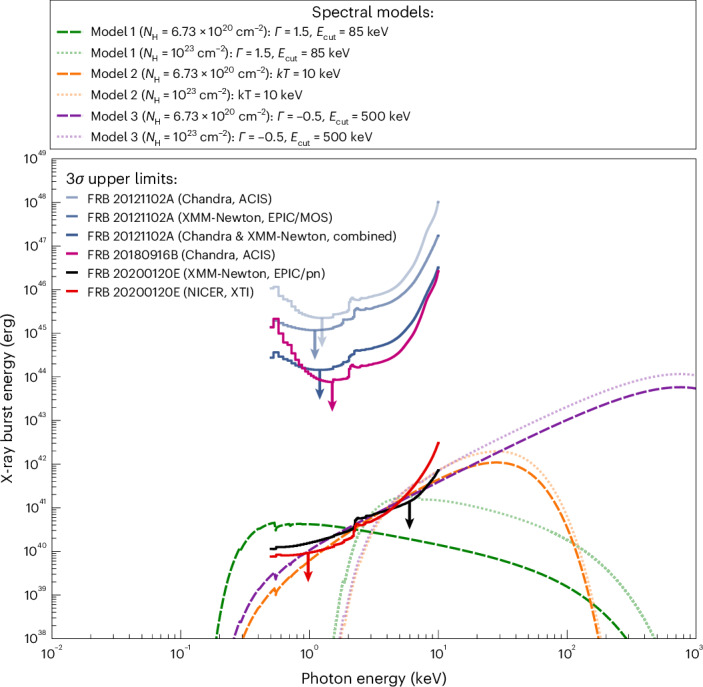
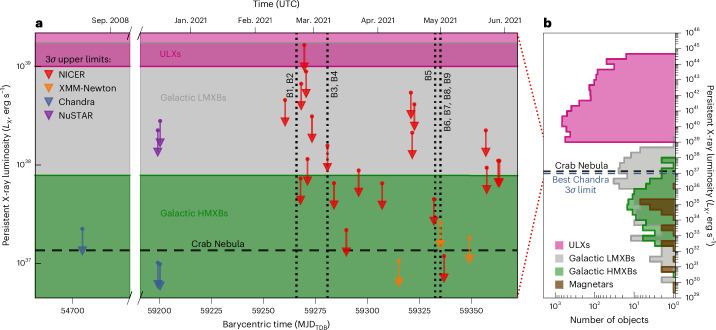
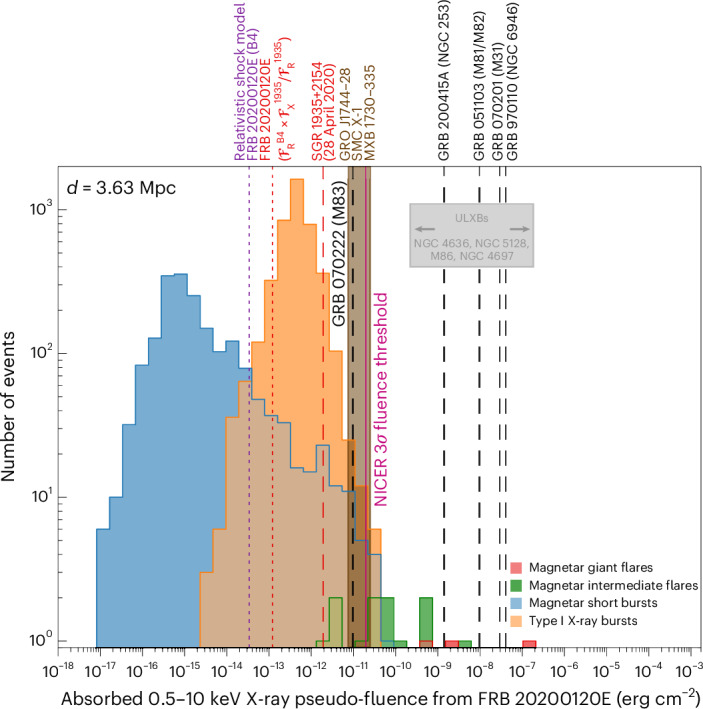
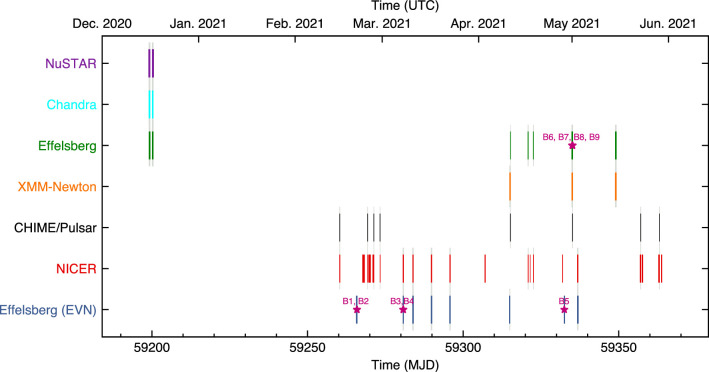
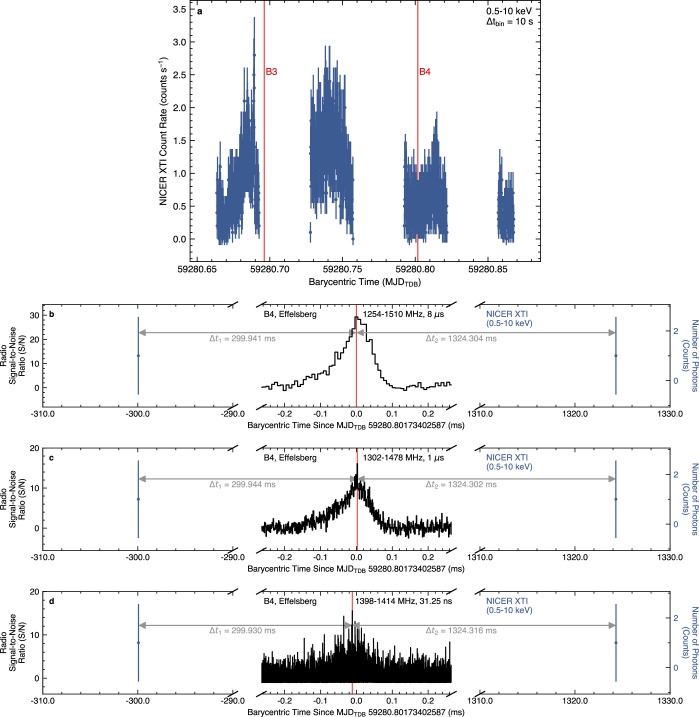
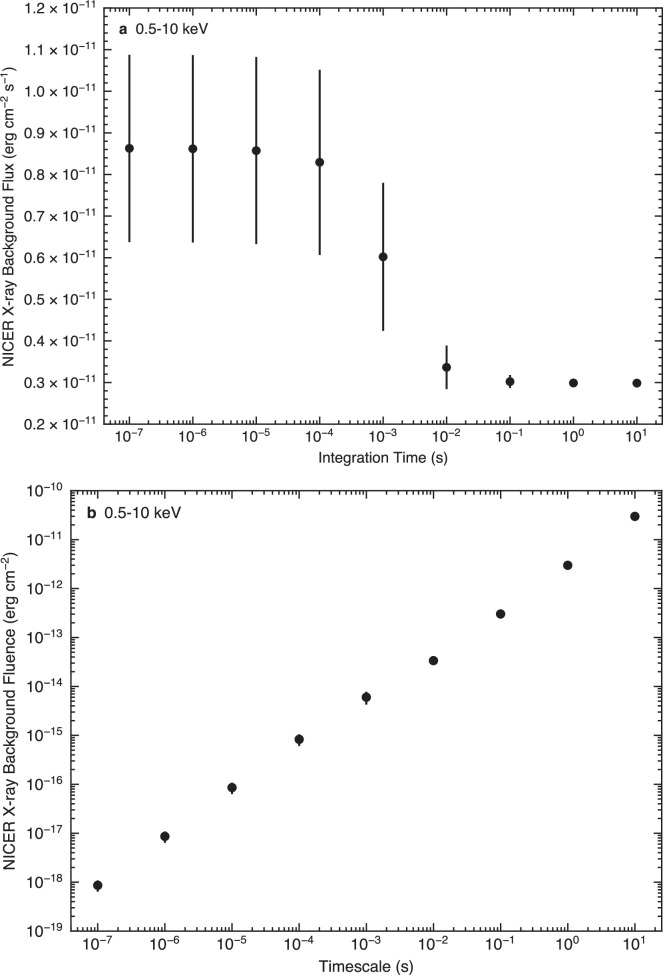
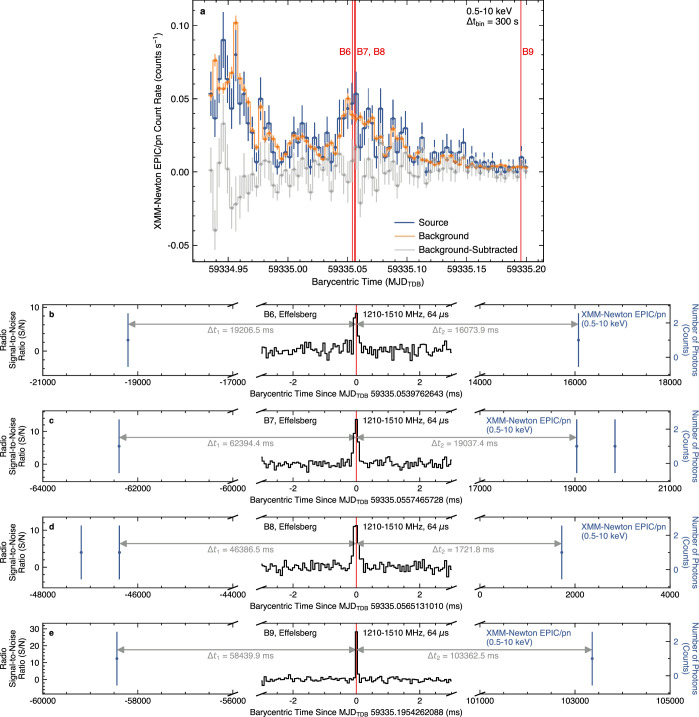
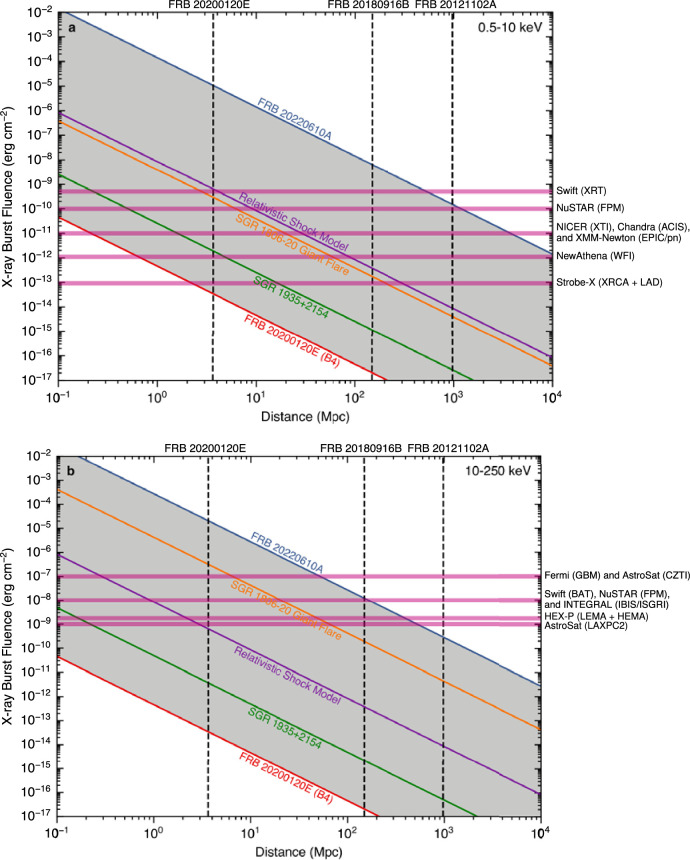
The precise origins of fast radio bursts (FRBs) remain unknown. Multiwavelength observations of nearby FRB sources can provide important insights into the enigmatic FRB phenomenon. Here we present results from a sensitive, broadband X-ray and radio observational campaign of FRB 20200120E, the closest known extragalactic repeating FRB source (located 3.63 Mpc away in an ~10-Gyr-old globular cluster). We place deep limits on the persistent and prompt X-ray emission from FRB 20200120E, which we use to constrain possible origins for the source. We compare our results with various classes of X-ray sources, transients and FRB models. We find that FRB 20200120E is unlikely to be associated with ultraluminous X-ray bursts, magnetar-like giant flares or an SGR 1935+2154-like intermediate flare. Although other types of bright magnetar-like intermediate flares and short X-ray bursts would have been detectable from FRB 20200120E during our observations, we cannot entirely rule them out as a class. We show that FRB 20200120E is unlikely to be powered by an ultraluminous X-ray source or a young extragalactic pulsar embedded in a Crab-like nebula. We also provide new constraints on the compatibility of FRB 20200120E with accretion-based FRB models involving X-ray binaries. These results highlight the power of multiwavelength observations of nearby FRBs for discriminating between FRB models.

Keywords: Compact astrophysical objects; High-energy astrophysics; Time-domain astronomy; Transient astrophysical phenomena.


Conflict of interest statement

Competing interestsThe authors declare no competing interests.

Figures

Fig. 1
Fig. 1. Radio bursts detected from FRB 20200120E using the Effelsberg radio telescope.
Top panels: total intensity (Stokes I) frequency-summed burst profiles. The shaded blue region in the top panels corresponds to the ±2σ burst width, which was used to calculate the S/N and peak flux density. Middle panels: dynamic spectra of the radio bursts. For bursts B1–B5, the red lines mark the edges of the individual 16-MHz subbands, and the white lines indicate frequency channels that were masked to mitigate RFI. Right panels: time-averaged frequency spectra of the bursts. The time resolution and frequency resolution of the data are labelled in the top right and top left corners of the middle panels, respectively.
Fig. 2
Fig. 2. Limits on the energy of X-ray bursts between 0.5 and 10 keV at the times of radio bursts from FRB 20200120E, FRB 20121102A and FRB 20180916B.
The red curve shows the 3σ limits derived from NICER observations of FRB 20200120E at the time of burst B4, after incorporating the spectral response of the NICER XTI. The black curve shows the 3σ limits derived from XMM-Newton observations of FRB 20200120E at the time of burst B9, after including the spectral response of the XMM-Newton EPIC/pn camera. The light-blue curves correspond to previous 3σ limits derived from Chandra and XMM-Newton observations at the times of multiple radio bursts from FRB 20121102A. Stacked 3σ limits for FRB 20121102A are shown in dark blue. The magenta curve shows previous 3σ limits derived from a Chandra observation at the time of a radio burst from FRB 20180916B. Several fiducial spectral models are shown for comparison. The green curves correspond to exponentially cut-off power-law spectra with Γ = 1.5 and Ecut = 85 keV, similar to the X-ray counterpart associated with the FRB-like radio burst detected from SGR 1935+2154 on 28 April 2020. The orange curves represent blackbody spectra with kT = 10 keV, which have been observed from some magnetar hard X-ray bursts,. The purple curves show exponentially cut-off power-law spectra with Γ = −0.5 and Ecut = 500 keV, similar to the spectrum observed during SGR 1806–20’s giant flare,. The dashed spectra were calculated using a hydrogen column density of NH = 6.73 × 1020 cm−2 towards FRB 20200120E, and the dotted spectra were calculated using a hydrogen column density of NH = 1023 cm−2 to illustrate the effects of high absorption local to the source. Larger hydrogen column densities yield harder X-ray spectra, with increased absorption at lower X-ray energies. Although high absorption towards FRB 20200120E is not expected, this scenario is shown for comparison. Each fiducial X-ray spectrum was normalized such that the integrated X-ray burst energy in the 0.5–10 keV energy range is equal to the NICER 0.5–10 keV band-averaged energy limit from FRB 20200120E.
Fig. 3
Fig. 3. X-ray and radio burst fluence and energy limits from observations of FRB 20200120E, along with previous measurements from simultaneous X-ray and radio observations of FRB sources and Galactic magnetars.
a, X-ray and radio fluence measurements of repeating FRB sources (purple), non-repeating FRB sources (green) and Galactic magnetars (blue). The red data points correspond to our X-ray and radio fluence measurements from NICER, XMM-Newton and Effelsberg observations of FRB 20200120E at the times of bursts B4 and B9. The black data points highlight X-ray and radio fluence measurements from observations of FRB 20180301A (luminosity distance of dL = 1.79 Gpc) with NICER and the Five-hundred-meter Aperture Spherical radio Telescope (FAST). The blue star indicates the X-ray and radio fluences of the X-ray and radio bursts detected from SGR 1935+2154 during an episode of FRB-like activity on 28 April 2020,,. The blue upper limits from SGR 1935+2154 show constraints on prompt radio emission from FAST observations during a series of X-ray bursts detected with the Fermi Gamma-ray Burst Monitor on 28 April 2020, close in time to the FRB-like radio burst. The blue cross corresponds to X-ray and radio measurements of an FRB-like burst from the radio magnetar 1E 1547.0–5408 (ref. ). The blue upper limit for SGR 1806–20 is derived from simultaneous radio and gamma-ray measurements at the time of the 27 December 2004 giant magnetar flare. The dashed grey lines indicate constant X-ray-to-radio fluence ratios (FX/FR). b, X-ray and radio energy measurements of repeating FRB sources, non-repeating FRB sources and Galactic magnetars. The data points in b are derived from the same measurements shown in a. Radio and X-ray energies were calculated using the distance and redshift of each object. DM-inferred distances were used for unlocalized FRB sources. The dashed grey lines indicate constant X-ray-to-radio energy ratios (EX/ER). In a and b, the yellow crosses highlight measurements from localized FRB sources with measured redshifts.
Fig. 4
Fig. 4. Persistent X-ray luminosity limits from observations of FRB 20200120E, compared with the persistent X-ray luminosities of ULX sources, Galactic LMXBs, Galactic HMXBs and magnetars.
a, 3σ persistent isotropic-equivalent X-ray luminosity limits from NICER (red), XMM-Newton (orange), Chandra (blue) and NuSTAR (purple) observations of FRB 20200120E. These X-ray luminosity limits are calculated using the 3σ persistent X-ray flux upper limits listed in Extended Data Table 2 and the distance to FRB 20200120E. The luminosity limits from NICER, XMM-Newton and Chandra observations are derived in the 0.5–10 keV energy band, and the luminosity limits from NuSTAR observations are derived in the 3–79 keV energy band. The vertical dotted black lines indicate the barycentric arrival times of the radio bursts shown in Fig. 1 (Extended Data Table 3). The horizontal dashed black line corresponds to the X-ray luminosity of the Crab Nebula. The shaded pink, grey and green regions indicate the range of X-ray luminosities of ULX sources, Galactic LMXBs and Galactic HMXBs spanning the persistent X-ray luminosity limits from FRB 20200120E. b, Histograms showing the persistent X-ray luminosity distributions of ULX sources (pink), Galactic LMXBs (grey), Galactic HMXBs (green) and magnetars (brown). The dashed blue line shows the most constraining 3σ persistent X-ray luminosity limit from a Chandra observation of FRB 20200120E on MJD 59200 (17 December 2020). The dotted red lines indicate the overlapping range of persistent X-ray luminosities from b that are shown in a.
Fig. 5
Fig. 5. Absorbed X-ray pseudo-fluence distributions of X-ray transients from the distance of FRB 20200120E in the 0.5–10 keV energy range, compared with our best prompt X-ray fluence limit from FRB 20200120E.
The red, green, blue and orange histograms show the X-ray pseudo-fluence distributions of magnetar giant flares, magnetar intermediate flares, magnetar short bursts and type I X-ray bursts from LMXBs, respectively. The vertical magenta line corresponds to our best prompt X-ray fluence limit from FRB 20200120E, derived from NICER observations at the time of burst B4. The X-ray fluence limit derived from XMM-Newton observations at the time of burst B9 is similar to the NICER X-ray fluence limit derived at the time of B4 (Table 1). The NICER X-ray fluence limit is only shown for clarity. The grey rectangle shows the range of X-ray pseudo-fluences derived from ULXBs detected from nearby galaxies. The vertical dashed black lines indicate the X-ray pseudo-fluences of GRBs believed to be associated with giant flares from extragalactic magnetars. The vertical dashed red line shows the predicted X-ray fluence of the X-ray burst associated with the FRB-like radio burst detected from SGR 1935+2154 on 28 April 2020, if it were emitted from the location of FRB 20200120E. The vertical dotted red line indicates the predicted X-ray fluence of burst B4, assuming the same X-ray-to-radio fluence ratio as the FRB-like radio burst detected on 28 April 2020 from SGR 1935+2154 (refs. ,,). The shaded brown region corresponds to the range of X-ray pseudo-fluences derived from bright type II X-ray bursts from GRO J1744–28 (ref. ) and MXB 1730–335 (ref. ), and X-ray flares resembling type II X-ray bursts from SMC X-1. The vertical dotted purple line shows the X-ray pseudo-fluence of the flare predicted for burst B4 from FRB 20200120E, based on predictions from the relativistic shock model, (Methods and Supplementary Information). The X-ray pseudo-fluences were calculated using a distance of d = 3.63 ± 0.34 Mpc (ref. ) to FRB 20200120E.
Extended Data Fig. 1
Extended Data Fig. 1. Timeline of X-ray and radio observations of FRB 20200120E performed between 2020 December and 2021 June.
The coloured rectangles indicate the start time, end time, and duration of each observation. X-ray observations carried out with NuSTAR, Chandra, XMM-Newton, and NICER are labelled using purple, cyan, orange, and red rectangles, respectively. The green rectangles correspond to independent observations carried out with the Effelsberg radio telescope, and the blue rectangles indicate radio observations performed with Effelsberg during interferometric observations with radio telescopes from the European Very Long Baseline Interferometry (VLBI) Network (EVN). Radio observations carried out with the CHIME/Pulsar system are shown using black rectangles. The shaded grey regions highlight times when multiple X-ray and radio instruments were used to perform simultaneous observations. The barycentric arrival times of the radio bursts, shown in Fig. 1, are labelled using magenta stars.
Extended Data Fig. 2
Extended Data Fig. 2. X-ray and radio light curves from simultaneous NICER and Effelsberg observations of FRB 20200120E, covering bursts B3 and B4.
Panel a: NICER 0.5–10 keV light curve, shown with time bin widths of 10 s. The error bars correspond to 1σ Poisson uncertainties on the count rates. The barycentric arrival times of bursts B3 and B4 are indicated by the vertical red lines. Panel b: Frequency-summed burst profile of B4, detected using the Effelsberg radio telescope in the 1254–1510 MHz frequency range and shown at a time resolution of 8 μs. Panel c: Frequency-summed burst profile of B4 in the 1302–1478 MHz frequency range, shown at a time resolution of 1 μs. Panel d: Frequency-summed burst profile of B4 in the 1398–1414 MHz frequency range, shown at a time resolution of 31.25 ns. The X-ray photons detected closest in time to burst B4 with NICER in the 0.5–10 keV energy band are also shown in panels b–d, along with 1σ Poisson uncertainties based on the photon counts. The time differences between the nearest X-ray photons and the peak barycentric arrival time of burst B4 are labelled using grey arrows. The vertical red lines in panels b–d indicate the peak barycentric arrival time of burst B4 in each frequency range.
Extended Data Fig. 3
Extended Data Fig. 3. Average background X-ray flux and fluence from NICER observations of blank sky regions.
Panel a shows the average absorbed background X-ray flux from NICER in the 0.5–10 keV energy band on timescales ranging from 100 ns to 10 s, and panel b shows the corresponding X-ray fluence on these timescales. These measurements were obtained by assuming an X-ray spectrum with a photon index of Γ = 1.4, similar to that of the diffuse X-ray background, and a hydrogen column density of NH = 6.73 × 1020 cm−2 towards FRB 20200120E. The error bars shown in panels a and b correspond to 1σ uncertainties (Methods).
Extended Data Fig. 4
Extended Data Fig. 4. X-ray and radio light curves from simultaneous XMM-Newton EPIC/pn and Effelsberg observations of FRB 20200120E, covering bursts B6, B7, B8, and B9.
Panel a: Source, background, and background-subtracted 0.5–10 keV light curves of FRB 20200120E from XMM-Newton’s EPIC/pn camera. The light curves are shown with time bin widths of 300 s, and the error bars correspond to 1σ Poisson uncertainties on the count rates. The barycentric arrival times of bursts B6, B7, B8, and B9 are indicated by the vertical red lines. Panels b–e: Frequency-summed burst profiles of B6, B7, B8, and B9, detected using the Effelsberg radio telescope in the 1210–1510 MHz frequency range and shown at a time resolution of 64 μs. The X-ray photons detected closest in time to these radio bursts with XMM-Newton’s EPIC/pn camera in the 0.5–10 keV energy band are also shown in panels b–e, along with 1σ Poisson uncertainties based on the photon counts. The time differences between the nearest X-ray photons and the peak barycentric arrival times of the radio bursts are labelled using grey arrows. The vertical red lines indicate the peak barycentric arrival times of the radio bursts.
Extended Data Fig. 5
Extended Data Fig. 5. Detectability of X-ray counterparts from FRB sources located at distances between 100 kpc and 10 Gpc with current and future X-ray instruments.
Panel a shows the predicted X-ray burst fluences in the soft X-ray band (0.5–10 keV), and panel b shows the predicted X-ray burst fluences in the hard X-ray band (10–250 keV). The red lines show predictions for bursts similar to B4 from FRB 20200120E, and the blue lines indicate the expected X-ray fluences for FRB 20220610A-like radio bursts. The red and blue lines in each energy band are derived by scaling the measured radio fluences by an X-ray-to-radio fluence ratio based on the X-ray and radio fluences observed from the FRB-like burst detected on 28 April 2020 from SGR 1935+2154,,. The green lines are also derived from X-ray and radio burst fluence measurements at the time of FRB-like activity on 28 April 2020 from SGR 1935+2154,,. The orange lines show the predicted X-ray fluences for giant flares similar to the 27 December 2004 flare observed from SGR 1806–20. The purple lines correspond to predictions from the relativistic shock model, for a fiducial X-ray flare energy of Eflare=1042 erg. The distances of three repeating FRB sources (FRB 20200120E, FRB 20180916B, and FRB 20121102A) are indicated by the vertical dashed black lines. The horizontal magenta lines correspond to nominal 3σ X-ray burst fluence detection thresholds for a selection of current (AstroSat, Chandra, Fermi, INTEGRAL, NICER, NuSTAR, Swift, and XMM-Newton) and future (HEX-P, NewAthena, and Strobe-X) X-ray instruments.

Similar articles

  • Fast radio bursts and the radio perspective on multi-messenger gravitational lensing.
    Pastor-Marazuela I. Pastor-Marazuela I. Philos Trans A Math Phys Eng Sci. 2025 Apr 10;383(2294):20240121. doi: 10.1098/rsta.2024.0121. Epub 2025 Apr 10. Philos Trans A Math Phys Eng Sci. 2025. PMID: 40205867 Free PMC article. Review.
  • A bright burst from FRB 20200120E in a globular cluster of the nearby galaxy M81.
    Zhang SB, Wang JS, Yang X, Li Y, Geng JJ, Tang ZF, Chang CM, Luo JT, Wang XC, Wu XF, Dai ZG, Zhang B. Zhang SB, et al. Nat Commun. 2024 Aug 28;15(1):7454. doi: 10.1038/s41467-024-51711-0. Nat Commun. 2024. PMID: 39198464 Free PMC article.
  • A fast radio burst associated with a Galactic magnetar.
    Bochenek CD, Ravi V, Belov KV, Hallinan G, Kocz J, Kulkarni SR, McKenna DL. Bochenek CD, et al. Nature. 2020 Nov;587(7832):59-62. doi: 10.1038/s41586-020-2872-x. Epub 2020 Nov 4. Nature. 2020. PMID: 33149288
  • A repeating fast radio burst source in a globular cluster.
    Kirsten F, Marcote B, Nimmo K, Hessels JWT, Bhardwaj M, Tendulkar SP, Keimpema A, Yang J, Snelders MP, Scholz P, Pearlman AB, Law CJ, Peters WM, Giroletti M, Paragi Z, Bassa C, Hewitt DM, Bach U, Bezrukovs V, Burgay M, Buttaccio ST, Conway JE, Corongiu A, Feiler R, Forssén O, Gawroński MP, Karuppusamy R, Kharinov MA, Lindqvist M, Maccaferri G, Melnikov A, Ould-Boukattine OS, Possenti A, Surcis G, Wang N, Yuan J, Aggarwal K, Anna-Thomas R, Bower GC, Blaauw R, Burke-Spolaor S, Cassanelli T, Clarke TE, Fonseca E, Gaensler BM, Gopinath A, Kaspi VM, Kassim N, Lazio TJW, Leung C, Li DZ, Lin HH, Masui KW, Mckinven R, Michilli D, Mikhailov AG, Ng C, Orbidans A, Pen UL, Petroff E, Rahman M, Ransom SM, Shin K, Smith KM, Stairs IH, Vlemmings W. Kirsten F, et al. Nature. 2022 Feb;602(7898):585-589. doi: 10.1038/s41586-021-04354-w. Epub 2022 Feb 23. Nature. 2022. PMID: 35197615
  • The discovery and scientific potential of fast radio bursts.
    Bailes M. Bailes M. Science. 2022 Nov 11;378(6620):eabj3043. doi: 10.1126/science.abj3043. Epub 2022 Nov 11. Science. 2022. PMID: 36356125 Review.

Cited by

References

    1. Lorimer, D. R., Bailes, M., McLaughlin, M. A., Narkevic, D. J. & Crawford, F. A bright millisecond radio burst of extragalactic origin. Science318, 777–780 (2007). - PubMed
    1. Petroff, E., Hessels, J. W. T. & Lorimer, D. R. Fast radio bursts. Astron. Astrophys. Rev.27, 4 (2019). - PMC - PubMed
    1. Cordes, J. M. & Chatterjee, S. Fast radio bursts: an extragalactic enigma. Annu. Rev. Astron. Astrophys.57, 417–465 (2019).
    1. Platts, E. et al. A living theory catalogue for fast radio bursts. Phys. Rep.821, 1–27 (2019).
    1. Kulkarni, S. R., Ofek, E. O., Neill, J. D., Zheng, Z. & Juric, M. Giant sparks at cosmological distances? Astrophys. J.797, 70 (2014).