[Preprint]. 2025 Jan 7:rs.3.rs-5530535.
doi: 10.21203/rs.3.rs-5530535/v1.

Micropillar-induced changes in cell nucleus morphology enhance bone regeneration by modulating the secretome

Affiliations

Micropillar-induced changes in cell nucleus morphology enhance bone regeneration by modulating the secretome

Xinlong Wang et al. Res Sq. .

Update in

Abstract

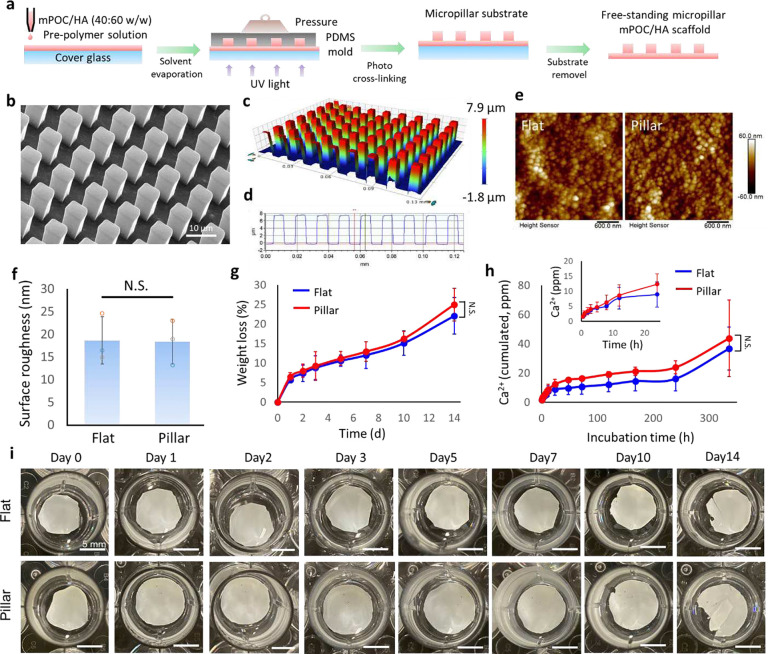
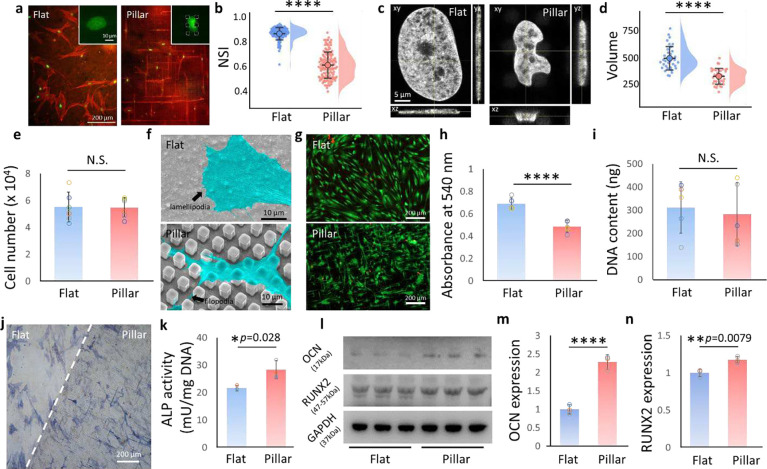
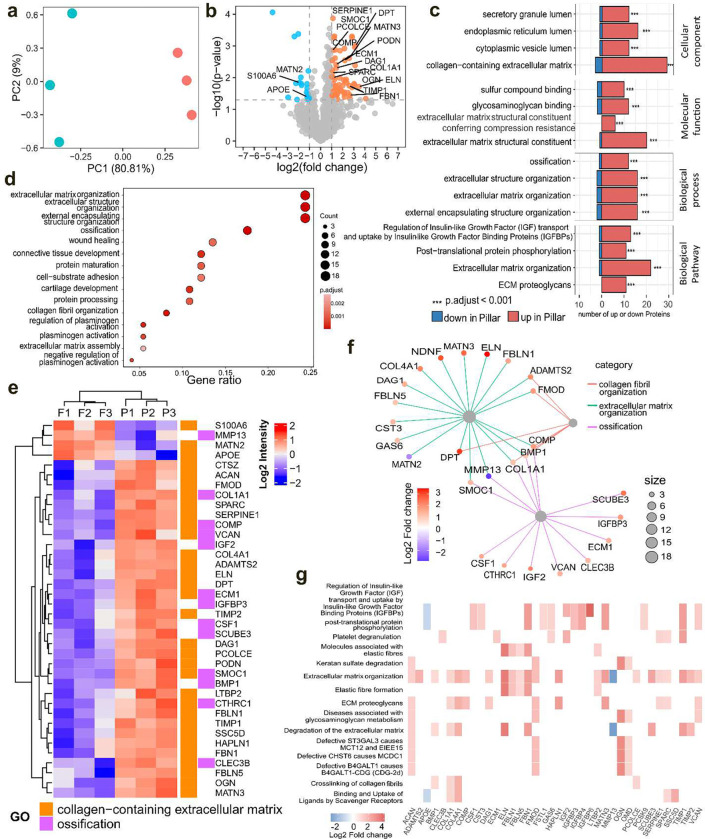
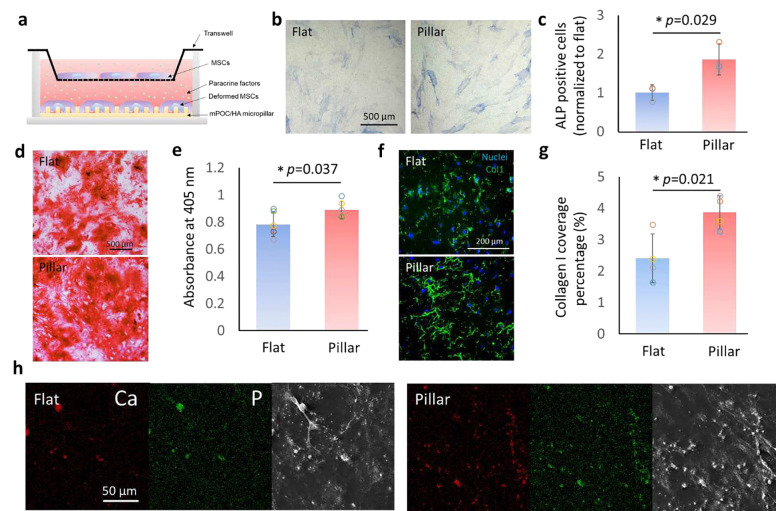
Nuclear morphology, which modulates chromatin architecture, plays a critical role in regulating gene expression and cell functions. While most research has focused on the direct effects of nuclear morphology on cell fate, its impact on the cell secretome and surrounding cells remains largely unexplored, yet is especially crucial for cell-based therapies. In this study, we fabricated implants with a micropillar topography using methacrylated poly(octamethylene citrate)/hydroxyapatite (mPOC/HA) composites to investigate how micropillar-induced nuclear deformation influences cell paracrine signaling for osteogenesis and cranial bone regeneration. In vitro, cells with deformed nuclei showed enhanced secretion of proteins that support extracellular matrix (ECM) organization, which promoted osteogenic differentiation in neighboring human mesenchymal stromal cells (hMSCs). In a mouse model with critical-size cranial defects, nuclear-deformed hMSCs on micropillar mPOC/HA implants elevated Col1a2 expression, contributing to bone matrix formation, and drove cell differentiation toward osteogenic progenitor cells. These findings indicate that micropillars not only enhance the osteogenic differentiation of human mesenchymal stromal cells (hMSCs) but also modulate the secretome, thereby influencing the fate of surrounding cells through paracrine effects.


Conflict of interest statement

Additional Declarations: There is NO Competing Interest.

Figures

Figure 1.
Figure 1.. Fabrication of surface engineered mPOC/HA implants.
a. Illustration shows the combination of UV lithography and contact printing to fabricate free-standing mPOC/HA micropillars. b. SEM image shows the micropillar structures made of mPOC/HA. c. Optical microscope image and d. cross-section analysis of mPOC/HA micropillars. e. Surface scanning of flat and micropillar implants by AFM. f. Surface roughness of flat and micropillar implants. N.S., no significant difference, n = 3 biological replicates. g. Degradation test and h. calcium release of flat and micropillar mPOC/HA implants. N.S., no significant difference, n = 4 biological replicates, insert plot shows the initial release of calcium within 24 h. i. Representative images of flat and micropillar implants at different time points after accelerated degradation.
Figure 2.
Figure 2.. Nuclear deformation promotes osteogenic differentiation of hMSCs.
a. Staining of nucleus (green) and F-actin (red) of hMSCs on flat and micropillar mPOC/HA surfaces. Insert: high magnification of cell nucleus. Dashed lines indicate micropillars. b. Analysis of nuclear shape index of hMSCs. n= 117 (flat) and 132 (pillar) collected from 3 biological replicates, ****p<0.0001. c. Orthogonal view of cell nucleus on flat and micropillar surfaces. d. Nuclear volume analysis based on 3D construction of the confocal images of cell nuclei. n= 35 cells collected from 3 biological replicates, ****p<0.0001. e. Initial cell attachment on flat and micropillar surfaces. n=5 biological replicates, N.S., no significant difference. f. SEM images show the cell attachment on flat and micropillar mPOC/HA surfaces. g. Live/dead staining of hMSCs on flat and micropillar surfaces at 72 h in osteogenic medium. h. Cell metabolic activity of cells on flat and micropillar surfaces tested by a MTT assay. n=5 biological replicates, ****p<0.0001. i. Cell proliferation tested via DNA content after 72 h induction. n=5 biological replicates, N.S., no significant difference. j. ALP staining of hMSCs on flat and micropillar surfaces after 7 d induction. k. ALP activity test of cells after 7 d osteogenic induction. n=3 biological replicates. l. Blot images of osteogenic marker OCN and RUNX2 in cells cultured on flat and micropillar implants. GAPDH is shown as a control. Quantification m. OCN and n. RUNX2 according to western blot tests. n=3 biological replicates, ****p<0.0001.
Figure 3.
Figure 3.. Secretome of hMSCs on flat and micropillar mPOC/HA surfaces.
a. PCA plot of differentially expressed proteins secreted by hMSCs on flat and micropillars. Cyan: flat; Red: micropillar. b. Volcano plot of proteins secreted by hMSCs seeded on micropillars compared to the flat surface. Blue dots and orange dots indicate significantly downregulated and upregulated proteins secreted by cells on micropillars compared to those on flat surface. Grey dots indicate non-significantly changed proteins. A threshold of expression greater than 2 times fold-change with p<0.05 was considered to be significant. Proteins that are related with collagen-ECM pathways are labelled. c. Top 4 significantly enriched GO and Pathways based on their adjusted p-values. d. The most significant enriched GO terms of the biological domain with respect to biological process. e. Heatmap of proteins that are related with collagen-containing extracellular matrix and ossification. F indicates flat samples and P indicates pillar samples, n=3 biological replicates for each group. f. The linkages of proteins and GO terms in biological process related with collagen fibers, ECM, and ossification as a network. g. Heatmap of top 15 enriched terms plotted based on Reactome pathway analysis.
Figure 4.
Figure 4.. The paracrine effect of cells with/without nuclear deformation tested through transwell assay.
a. Schematic illustration of the experiment setup. b. ALP staining and c. quantification of ALP positive cells on transwell membrane incubated with undeformed and deformed MSCs (n=3). d. ARS staining and e. quantification of cells on transwell membrane incubated with undeformed and deformed MSCs (n=6). f. Immunofluorescence staining images of collagen in ECM of cells on transwell membrane incubated with undeformed and deformed MSCs. g. The coverage of collagen analyzed according to the staining images (n=4). h. EDS images showing Ca, P, and SEM images of cells on transwell membrane incubated with undeformed and deformed MSCs.
Figure 5.
Figure 5.. mPOC/HA micropillar implant promotes bone regeneration in vivo.
a. Image shows implantation of hMSC seeded flat and micropillar mPOC/HA scaffolds. b. Staining images of nuclei (green) and F-actin (red) of cells on the implants. c. Representative μCT images of a typical animal implanted with hMSC-seeded flat (left) and micropillar (right) scaffolds at 12-weeks post-surgery. d. Regenerated bone volume in the defect region (n = 5 animals). e. Trichrome staining of the defect tissue treated with flat and micropillar implants. f. Average thickness of regenerated tissues with implantation of flat and micropillar scaffolds (n = 5 animals). IHC staining of osteogenic marker, g. OPN and h. OCN, in regenerated tissues with flat and micropillar implants.
Figure 6.
Figure 6.. Spatial transcriptomic analysis of tissues regenerated with flat and micropillar implants.
a. Spatial plot of Col1a2 expression profile in tissues regenerated with flat mPOC/HA implant and micropillar mPOC/HA implant. Arrow indicates enhanced expression around dura layer. b. The heatmap showing the top ten up- and down-regulated DEGs (pillar vs flat) in tissues regenerated with flat mPOC/HA implant, micropillar mPOC/HA implant, and native skull tissue. c. Gene Ontology analysis results based on the top 100 up-regulated genes (pillar vs flat). d. Deconvoluted cell types in each spatial capture location in flat and micropillar groups. Each pie chart shows the deconvoluted cell type proportions of the capture location. e. Bar plots of the cell type proportions in tissues regenerated with flat mPOC/HA implant and micropillar mPOC/HA implant. LMPs, MSCs, and fibroblasts are the predominant cell types. f. Violin plot of the proportion of LMPs in flat and micropillar groups. g. Top enriched processes associated with LMP compared with other cell lineages. LMP: late mesenchymal progenitor cells; MSC: mesenchymal stromal cells; OLC: MSC-descendant osteolineage cells

References

    1. Rippe K. Dynamic organization of the cell nucleus. Curr. Opin. in Genet. Dev. 17, 373–380 (2007). - PubMed
    1. Kalukula Y., Stephens A. D., Lammerding J. & Gabriele S. Mechanics and functional consequences of nuclear deformations. Nat. Rev. Mol. Cell Biol. 23, 583–602 (2022). - PMC - PubMed
    1. Ramdas N. M. & Shivashankar G. V. Cytoskeletal Control of Nuclear Morphology and Chromatin Organization. J. Mol. Biol. 427, 695–706 (2015). - PubMed
    1. Heckenbach I. et al. Nuclear morphology is a deep learning biomarker of cellular senescence. Nat. Aging 2, 742–755 (2022). - PMC - PubMed
    1. Seelbinder B. et al. Nuclear deformation guides chromatin reorganization in cardiac development and disease. Nat. Biomed. Eng. 5, 1500–1516 (2021). - PMC - PubMed

Publication types

LinkOut - more resources