[Preprint]. 2025 Jan 6:rs.3.rs-5732026.
doi: 10.21203/rs.3.rs-5732026/v1.

Prognostic gene expression and microRNA profiling signatures and genetic alterations in primary testicular diffuse large B-cell lymphoma

Affiliations

Prognostic gene expression and microRNA profiling signatures and genetic alterations in primary testicular diffuse large B-cell lymphoma

Ken Young et al. Res Sq. .

Update in

Abstract

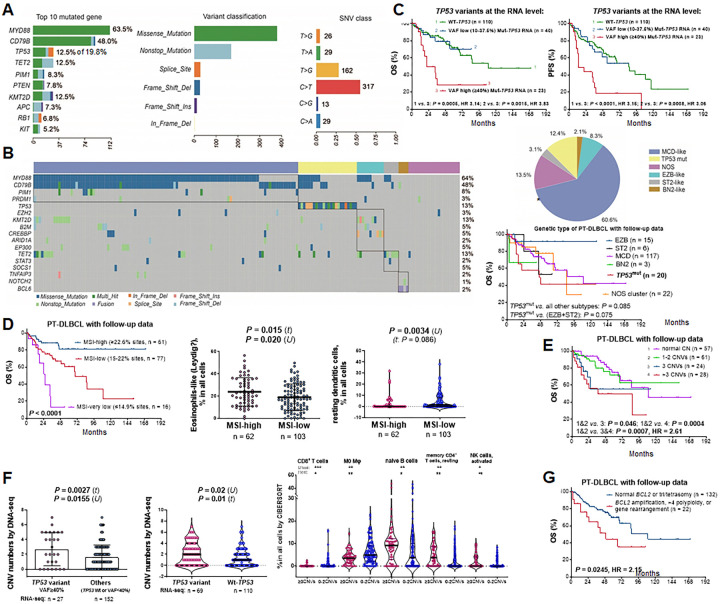
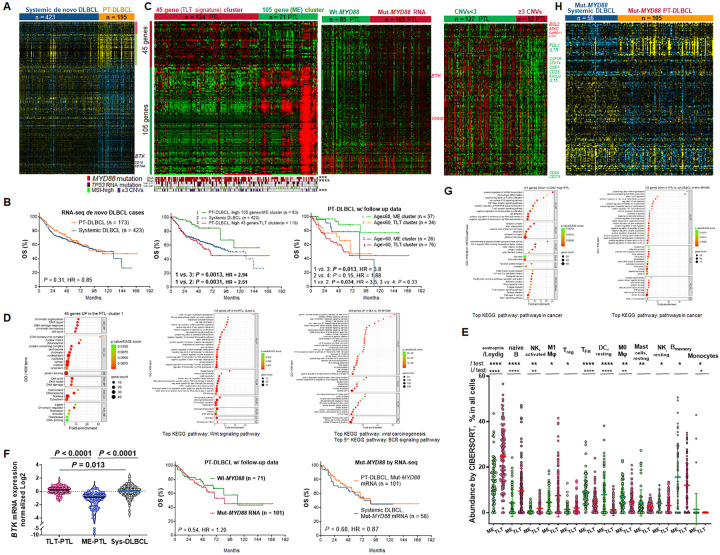
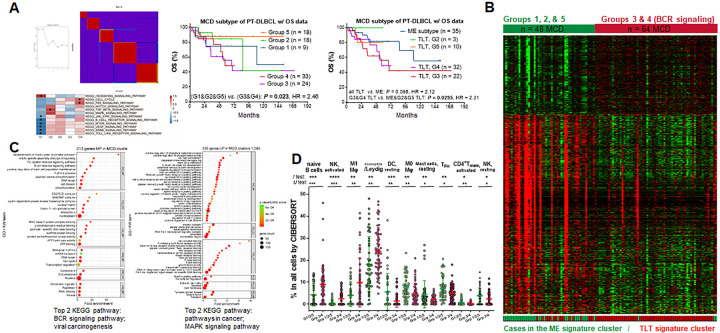
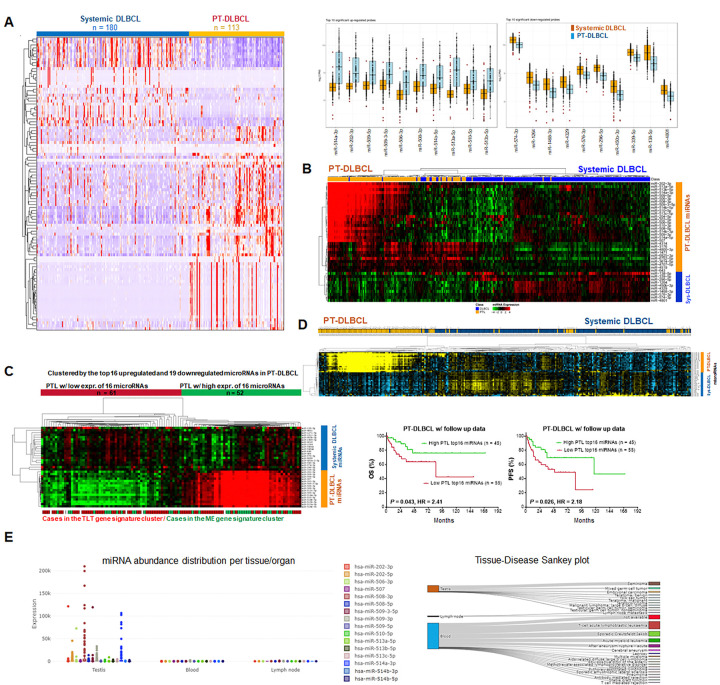
Primary testicular diffuse large B-cell lymphoma (PT-DLBCL) is a rare and aggressive lymphoma with molecular heterogeneity not well characterize. In this study, we performed next-generation sequencing analysis for a large number of DNA and RNA samples from patients with PT-DLBCL. DNA sequencing analysis identified ≥ 3 chromosomes with copy number variations (CNVs) and microsatellite instability as prognostic biomarkers, rather than MYD88 mutations and genetic subtypes. Remarkably, targeted RNA-seq analysis in 195 patients revealed that TP53 mutations with a ≥ 40% variant allele frequency had significantly adverse prognostic impact, and that a 150-gene expression signature subdivided PT-DLBCL into two distinct clusters, termed as testicular lymphoma tumor (TLT) and microenvironment (ME) subtypes. The TLT subtype featured upregulation of genes involved in B-cell receptor signaling, cell cycle, DNA damage and repair, higher frequencies of CNVs and MYD88 mutations, elder ages, larger tumor sizes, and significantly poorer survival. Genomic microRNA profiling analysis identified significantly differentially expressed microRNAs between 113 PT-DLBCL and 180 systemic DLBCL patients, and further subdivided the PT-DLBCL cohort by microRNA signatures. The subcohort with upregulation of 16 microRNAs associated with PT-DLBCL and testicular tissue expression had significantly better survival. This study revealed characteristic genetic, gene expression, and microRNA profiles and heterogeneity in PT-DLBCL.

Keywords: BCR; CIBERSORT; CNV; DLBCL; GEP; IP-LBCL; MCD; MSI; MYD88; NGS; PTL; RNA-seq; TME; TP53 mutation; clustering; epigenetic; gene signature; genetic alteration; microRNA; profiling; subtyping; testicular lymphoma; testis.


Conflict of interest statement

Declarations Competing Interests All authors declare no competing financial interests.

Figures

Figure 1
Figure 1. DNA sequencing results and genetic biomarkers in PT-DLBCL.
(a) Overview of DNA mutations in 192 patients with PT-DLBCL. For TP53 mutation, only those used for genetic subtyping were shown. (b) Oncoplot showing that 192 patients with PT-DLBCL were clustered into 6 genetic subtypes using the LymphPlex algorithm. MCD-like was the most frequent subtype, as shown in the pie chart. No significant prognostic effects were observed. Only the TP53mut subtype showed a non-significant trend of poorer overall survival (OS). * For TP53 mutations, only those used for LymphPlex clustering and not concurrent with subtype-predictor mutations in the MCD-like, EZB-like and ST2-like subtypes were displayed in the oncoplot. (c) Remarkably, presence of TP53 mutation with a VAF≥40% by RNA-seq variant analysis was associated with significantly poorer OS and progression-free survival (PFS). (d) High percentages of MSI sites among evaluated sites (mostly >100) by DNA sequencing analysis were associated with significantly better survival of patients with PT-DLBCL. CIBERSORT analysis for corresponding RNA-seq data showed associations of MSI-high with higher proportion of eosinophils (possibly were Leydig cells in the testis) in the scatter plot (lines represent mean values ±SD for each group) and lower proportion of resting dendritic cells in the violin plot (lines represent medians and quantiles). (e) Patients with ≥3 chromosomes with copy number alterations (CNVs) had significantly poorer OS. (f) The scatter plot shows that TP53 RNA variants with a VAF≥40% was associated with a high mean chromosomal CNV number in PT-DLBCL significantly by t test. P value by U test is also provided. The rst violin plot shows that all TP53 variants by RNA-seq variant analysis (VAF≥10%) were associated with a higher median number of chromosomes with CNVs by DNA sequencing analysis significantly by U test. P value by t test is also provided. The second violin plot shows correlations of ≥3 chromosomal CNVs with lower median proportions of CD8+ T cells and M0 macrophages, whereas higher proportions of naïve B cells, resting memory CD4 T cells, and activated NK cells by CIBERSORT analysis. (g) Patients with BCL2 gene amplification, >4 polyploid, or BCL2 gene rearrangement by FISH analysis had significantly poorer survival than other patients with PT-DLBCL.
Figure 2
Figure 2. Targeted RNA-seq gene expression profiling analysis in PT-DLBCL.
(a) Significantly differentially expressed genes (DEGs) between PT-DLBCL and systemic DLBCL patients. (b) The sequenced PT-DLBCL and systemic DLBCL cases did not show significant difference in overall survival (OS). The ME subtype of PT-DLBCL had significantly better OS than the TLT subtype and systemic DLBCL cases. When the age factor was integrated into the survival analysis, the favorable prognostic effect of ME subtype was significant only in patients ≤60 years old. (c) Left heatmap: median-centered unsupervised clustering using the 150-gene PTL signature in the PT-DLBCL cohort formed two clusters of patients (each column represents one patient) marked by horizontal red/green bars, which expressed high levels of 45 (TLT subsignature) and 105 genes (ME subsignature) of the PTL signature (each row represents expression of one gene), respectively. The vertical red/green color bars for two gene clusters on the left side of this heatmap and the similar but lighter color bars on the right side of heatmap in panel A indicate that the gene clusters were similar (only a few genes were different). The aligned case plot underneath the heatmap shows the status of MYD88mutation detected by DNA and RNA sequencing, respectively, TP53 mutation detected by RNA sequencing with VAF≥10% and VAF≥40%, respectively, MSI-high, and ≥3 chromosomal CNVs by DNA sequencing analysis for patients in the heatmap. Significant frequency differences between two clusters are marked, ***, P < 0.001; ****, P < 0.0001. Middle heatmap: 447 DEGs between patients with and without MYD88mutations by RNA sequencing analysis. Right heatmap: 134 DEGs between patients with and without ≥3 chromosomes with CNVs by DNA sequencing. (d) Enrichment dot plots to visualize the significantly (FDR<0.05) enrichment results by DAVID functional annotation tool for 45 genes, 105 genes, and 384 genes (part of enrichment results) in the rst two heatmaps of panel C. The color scale shows the enrichment P values, horizontal axis shows fold enrichment or gene ratio, and dot sizes represents numbers of genes hits for the significant GO and KW terms. (e) Scatter plot showing significant differences in CIBERSORT results between the TLT and ME clusters. Each dot represents one case. Lines represent mean values ±SD. Significance: *P < 0.05; ** P< 0.01; *** P < 0.001, ****, P < 0.0001. (f) The ME subtype had significantly lower BTK transcription than the TLT subtype of PT-DLBCL and systemic DLBCL. The violin plot shows normalized BTK levels in the heatmaps in panels A and C. No significant differences in patient survival were observed between PT-DLBCL with and without MYD88mutation, and between PT-DLBCL and systemic DLBCL with MYD88 mutation by RNA sequencing. (g) Enrichment dot plots showing part of significantly (FDR<0.05) enriched GO and KW terms and KEGG pathways for 121 genes downregulated in patients with ≥3 CNVs in the third heatmap in panel C and for 109 genes downregulated in PT-DLBCL vs. systemic DLBCL with MYD88 mutations in panel H.
Figure 3
Figure 3. Clustering analysis in the MCD-like subtype.
(a) Consensus matrix heatmap was based on the optimal clusters value (k=5) by cophenetic correlation coefficients for hierarchically clustered matrices. Enriched pathways in the five clusters by Gene Set Variation Analysis and multiple correction are shown in the heatmap. Significant enrichment was marked by an asterisk. Left survival curves show the OS of patients in the five GEP groups within the MCD-like genetic subtype. Right survival curves show survival analysis for effects of TLT/ME subtyping and G1-G5 grouping in patients with MCD-like genetic subtype. (b) Significantly differentially expressed genes between the combined G1, G2, and G5 cases and the combined G3 and G4 cases. The bar aligned below shows the TLT/ME subtypes of patients in the heatmap (each column represents one patient). (c) Enrichment dot plots to visualize part of significantly (FDR<0.05) enriched GO and KW terms for DEGs between combined G1, G2, and G5 cases and combined G3 and G4 cases. (d) The scatter plot showing significant association of G3/G4 cases with higher proportions of eosinophils-like cells, naïve B cells, activated NK cells, and M1 macrophages, and association of G1/G2/G5 cases with higher proportions of resting dendritic cells, M0 macrophages, resting mast cells, follicular helper T (TFH) cells, activated memory CD4 T cells, and resting NK cells by CIBERSORT analysis. Lines represent mean values ±SD. Significance: *P < 0.05; ** P < 0.01; *** P < 0.001, ****, P < 0.0001.
Figure 4
Figure 4. MicroRNA profiling analysis.
(a) Heatmap showing 99 significantly differentially expressed microRNAs between sequenced systemic DLBCL and PT-DLBCL cases. Boxplots showing top 10 upregulated and top 10 downregulated microRNAs in PT-DLBCL. (b) Heatmap showing top 40 (including 30 up and 10 down microRNAs) significantly differentially expressed microRNAs between systemic DLBCL and PT-DLBCL. (c) Heatmap for expression of 35 microRNA in PT-DLBCL cases by median-centered unsupervised clustering. Patients with high expression of 16 microRNAs upregulated in PT-DLBCL vs. systemic DLBCL had significantly better survival than other sequenced PT-DLBCL cases. (d) Heatmap for expression of the 35 microRNA signature (16 upregulated and 19 downregulated microRNAs in PT-DLBCL) in PT-DLBCL and systemic DLBCL cases by unsupervised clustering. (e) Expression (Reads counts) of 16 microRNAs in testis, blood, and lymph nodes in the miTED database.

References

    1. Pollari M, Leivonen SK, Leppä S. Testicular Diffuse Large B-Cell Lymphoma-Clinical, Molecular, and Immunological Features. Cancers (Basel). 2021;13(16). - PMC - PubMed
    1. Twa DDW, Mottok A, Savage KJ, Steidl C. The pathobiology of primary testicular diffuse large B-cell lymphoma: Implications for novel therapies. Blood Rev. 2018;32(3):249–55. - PubMed
    1. Chen B, Cao DH, Lai L, Guo JB, Chen ZY, Huang Y, et al. Adult primary testicular lymphoma: clinical features and survival in a series of patients treated at a high-volume institution in China. BMC Cancer. 2020;20(1):220. - PMC - PubMed
    1. Alaggio R, Amador C, Anagnostopoulos I, Attygalle AD, Araujo IBO, Berti E, et al. The 5th edition of the World Health Organization Classification of Haematolymphoid Tumours: Lymphoid Neoplasms. Leukemia. 2022;36(7):1720–48. - PMC - PubMed
    1. Roschewski M, Phelan JD, Jaffe ES. Primary Large B-cell Lymphomas of Immune-Privileged Sites. Blood. 2024. - PubMed

Publication types

LinkOut - more resources