. 2025 Jan 10:17:1503396.
doi: 10.3389/fnmol.2024.1503396. eCollection 2024.

Neurotherapeutic impact of vanillic acid and ibudilast on the cuprizone model of multiple sclerosis

Affiliations

Neurotherapeutic impact of vanillic acid and ibudilast on the cuprizone model of multiple sclerosis

Rasha M Alderbi et al. Front Mol Neurosci. .

Abstract

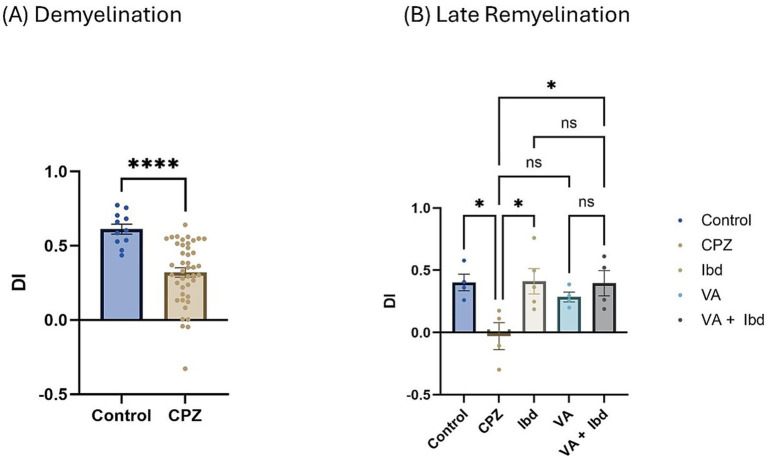
Multiple sclerosis (MS) affects 2.8 million people worldwide. Although the cause is unknown, various risk factors might be involved. MS involves the immune system attacking the central nervous system's myelin sheath, leading to neuron damage. This study used a cuprizone (CPZ)-intoxicated mouse model to simulate MS's demyelination/remyelination process. It evaluated the molecular, histological, and behavioral effects of vanillic acid (VA), a natural phenolic acid, alone and with Ibudilast (IBD), a clinically tested MS medication. Mice were divided into a control group (regular chow) and a CPZ group (0.3% cuprizone chow for 5 consecutive weeks). During remyelination, the CPZ group was split into four groups: no therapy, 10 mg/kg of IBD, 30 mg/kg of VA, and combined, each treated for 4 weeks. Behavioral, biochemical, molecular, and histopathological tests occurred in the 5th week (demyelination), 7th (early remyelination), and 9th (late remyelination). Cognitive assessments were at weeks 5 and 9. VA enhanced motor, coordination, and cognitive impairments in CPZ-intoxicated mice and improved histopathological, molecular, and biochemical features during early remyelination. IBD improved behavioral abnormalities across all tests, but combined therapy showed no significant difference from single therapies. Further investigations are necessary to understand VA's mechanisms and potential as an MS treatment.

Keywords: anti-inflammatory; cuprizone model; ibudilast; multiple sclerosis; vanillic acid.


Conflict of interest statement

The authors declare that the research was conducted in the absence of any commercial or financial relationships that could be construed as a potential conflict of interest.

Figures

Figure 1
Figure 1
Wire Hang test. (A) Hanging time in week 5 of demyelination in control compared to CPZ group. (B) Hanging time in early remyelination at week 7 was shown in control and treated groups (IBD, VA, VA + IBD) compared to CPZ. (C) Hanging time in late remyelination at week 9 was displayed for control, CPZ, IBD, VA, and VA + IBD group. Data in (A) was analyzed by unpaired two-tailed t test. Data in (B) and (C) was analyzed using one-way ANOVA followed by Tukey’s multiple comparisons test. Data was presented as mean ± SEM, and p < 0.05 was considered significantly different. ns, non-significant, *p < 0.05, **p < 0.01, ***p < 0.001, and ****p < 0.0001. Sec., seconds.
Figure 2
Figure 2
Grip strength (GS) expressed as normalized force. (A) GS measured in week 5 of demyelination represented by unpaired two-tailed t test. (B) GS in early remyelination measured in week 7. (C) GS in late remyelination measured in week 9. Both (B,C) were analyzed using one-way ANOVA followed by Tukey’s multiple comparison test. Data is presented as mean ± SEM. p < 0.05 was considered significantly different. ns, non-significant, *p < 0.05; **p < 0.01; ***p < 0.001; and ****p < 0.0001.
Figure 3
Figure 3
The total distance moved (TDM) in open field test (OFT). (A) Displayed week 5 TDM during demyelination. (B) Showed TDM in early remyelination at week 7 in control, CPZ, and treated groups. (C) Showed TDM in late remyelination in week 9. Data in (A) was analyzed by unpaired two-tailed t test. Data in (B,C) was analyzed using one-way ANOVA followed by Tukey’s multiple comparisons test. Data was presented as mean ± SEM, and p < 0.05 was considered significantly different. ns, non-significant; *p < 0.05; **p < 0.01; and ***p < 0.001. OFT, open field test; cm, centimeter.
Figure 4
Figure 4
Latency to fall measured using Rotarod test. (A) Latency to fall in week 5 of demyelination measured in control and CPZ group. (B) Latency to fall of control, CPZ, IBD, VA, and VA + IBD measured in week 7 of early remyelination. (C) Latency to fall of control, CPZ, IBD, VA, and VA + IBD measured in week 9 at late remyelination. Data in (A) was analyzed by unpaired two-tailed t test. Data in (B,C) was analyzed using one-way ANOVA followed by Tukey’s multiple comparisons test. Data was presented as mean ± SEM, and p < 0.05 was considered significantly different. ns, non-significant; *p < 0.05, and ****p < 0.0001. Sec., second.
Figure 5
Figure 5
Percentage (%) of spontaneous alteration in Y-maze. (A) % of spontaneous alteration was calculated in control and CPZ group at week 5 of demyelination and analyzed by unpaired two-tailed t test. (B) % of spontaneous alteration at last week (W 9) of late remyelination shown in control, CPZ, IBD, VA, and VA + IBD. (B) Was analyzed using one-way ANOVA followed by Tukey’s multiple comparisons test. Data was presented as mean ± SEM, and p < 0.05 was considered significantly different. ns, non-significant; *p < 0.05, and ****p < 0.0001. %, percentage.
Figure 6
Figure 6
Acetylcholinesterase activity. (A) Acetylcholinesterase activity in week 5 of demyelination measured in Control and CPZ group. (B) Acetylcholinesterase Activity of Control, CPZ, IBD, VA, and VA + IBD measured in week 7 of early remyelination. (C) Acetylcholinesterase Activity of Control, CPZ, IBD, VA, and VA + IBD measured in week 9 at late remyelination. Data in (A) was analyzed by unpaired two-tailed t test. Data in (B,C) was analyzed using one-way ANOVA followed by Tukey’s multiple comparisons test. Data was presented as mean ± SEM, and p < 0.05 was considered significantly different. ns, non-significant; *p < 0.05, **p < 0.01, ***p < 0.001, and ****p < 0.0001. AChE, Acetylcholinesterase; U, unit; mg, milligram.
Figure 7
Figure 7
Representative photomicrographs of the corpus callosum (CC) at demyelination. (A,B) The Control group showed a typical blue staining intensity and a tightly packed arrangement of myelinated fibers in the corpus callosum (CC). Inset shows regularly dispersed myelinated nerve fibers (My) and oligodendrocytes (arrows). The myelinated nerve fibers are highly defined, darkly pigmented, and are positioned in between the nerve fibers. There is a strong positive reactivity of myelin basic protein in both the myelin fibers (My) and oligodendrocytes (arrows). (C,D) The CPZ group exhibited a minor reduction in staining intensity in the previously mentioned areas compared to the control group. The observed findings include a reduction and disorganization in the myelinated nerve fibers (My) and a decrease of oligodendrocytes size (arrows). There is a weak reaction to myelin basic protein of myelin fibers (My) and oligodendrocytes (arrows).
Figure 8
Figure 8
Novel Object Recognition Test (NORT) expressed as Discrimination Index (DI). (A) DI measured in week 5 of demyelination in control and CPZ using unpaired two-tailed t test. (B) DI measured in week 9 of late remyelination in control, CPZ, IBD, VA, and VA + IBD using one-way ANOVA followed by Tukey’s multiple comparisons test. Data was presented as mean ± SEM, and p < 0.05 was considered significantly different. ns, non-significant; *p < 0.05, and ****p < 0.0001. NORT, Novel Object Recognition Test; DI, Discrimination Index.
Figure 9
Figure 9
Novel Object Recognition Test (NORT) expressed as Preference Index percentage (PI %). (A) PI % measured in week 5 of demyelination in control and CPZ using unpaired two-tailed t test. (B) PI % measured in week 9 of late remyelination in control, CPZ, IBD, VA, and VA + IBD using one-way ANOVA followed by Tukey’s multiple comparisons test. Data was presented as mean ± SEM, and p < 0.05 was considered significantly different. ns, non-significant; *p < 0.05, and ****p < 0.0001. NORT, Novel Object Recognition Test; PI, Preference Index; %, percentage.
Figure 10
Figure 10
Fold change in Interlukin-4 mRNA. (A) Fold change in Il-4 in week 5 of demyelination measured in Control and CPZ group. (B) Fold change in Il-4 of Control, CPZ, IBD, VA, and VA + IBD measured in week 7 of early remyelination. (C) Fold change in Il-4 of Control, CPZ, IBD, VA, and VA + IBD measured in week 9 at late remyelination. Data in (A) was analyzed by unpaired two-tailed t test. Data in (B,C) was analyzed using one-way ANOVA followed by Tukey’s multiple comparisons test. Data was presented as mean ± SEM, and p < 0.05 was considered significantly different. ns, non-significant; *p < 0.05, **p < 0.01, and ****p < 0.0001.
Figure 11
Figure 11
Fold change in Cyclooxygenase-2 (Cox-2) mRNA. (A) Fold change in Cox-2 in week 5 of demyelination measured in Control and CPZ group. (B) Fold change in Cox-2 of Control, CPZ, IBD, VA, and VA + IBD measured in week 7 of early remyelination. (C) Fold change in Cox-2 of Control, CPZ, IBD, VA, and VA + IBD measured in week 9 at late remyelination. Data in (A) was analyzed by unpaired two-tailed t test. Data in (B,C) was analyzed using one-way ANOVA followed by Tukey’s multiple comparisons test. Data was presented as mean ± SEM, and p < 0.05 was considered significantly different. ns, non-significant; *p < 0.05, and **p < 0.01.
Figure 12
Figure 12
Representative photomicrographs of the corpus callosum (CC) at early remyelination. (A,B) Control group showed normal dense blue staining intensity and densely packed, myelinated fibers in the corpus callosum (CC). Inset displayed normally distributed myelinated nerve fibers (My) and oligodendrocytes (arrows) that appear well defined, darkly stained and arranged in between the nerve fibers. Moderate positive myelin basic protein reaction of myelin fibers (My) and oligodendrocytes (arrows). (C,D) CPZ group showed marked decrease in staining intensity in the above areas as compared to control. Inset displayed decreased myelinated nerve fibers (My) and less number of oligodendrocytes of small size (doted arrows). Weak myelin basic protein reaction of myelin fibers (My) and oligodendrocytes (arrows). (E,F) IBD group showed mild increase in staining intensity in the above areas as compared to the CPZ group. Inset displayed the presence of some demyelinated nerve fibers (My) and oligodendrocytes (arrows). Positive myelin basic protein reaction of myelin fibers (My) and oligodendrocytes (arrows). (G,H) VA group showed mild increase in staining intensity in the above areas as compared to the CPZ group. Inset displayed the presence of less demyelinated nerve fibers (My) and oligodendrocytes (arrows) from CC. Moderate myelin basic protein reaction of myelin fibers (My) and oligodendrocytes (arrows). (I,J) VA + IBD showed blue staining intensity in the above areas more or less similar to control group. Inset displayed the presence of myelinated nerve fibers (My) and oligodendrocytes (arrows) from CC. Strong myelin basic protein reaction of myelin fibers (My) and oligodendrocytes (arrows). ML: molecular layer; PmL: pleomorphic layer; CA1: first part of cornu ammonis. (A,C,E,I) Luxol fast blue stain (LFB) × 200; (B,D,F,J) Myelin basic protein (MBP) × 200.
Figure 13
Figure 13
Representative photomicrographs of the corpus callosum (CC) at late remyelination. (A,B) Control group showed normal dense blue staining intensity and densely packed, myelinated fibers in the corpus callosum (CC). Inset displayed normally distributed myelinated nerve fibers (My) and oligodendrocytes (arrows) that appear well defined, darkly stained, and arranged in between the nerve fibers. Strong positive myelin basic protein reaction of myelin fibers (My) and oligodendrocytes (arrows). (C,D) CPZ group showed marked decrease in staining intensity in the above areas as compared to control. Inset displayed decreased myelinated nerve fibers (My) and less number of oligodendrocytes of small size (doted arrows). Mild myelin basic protein reaction of myelin fibers (My) and oligodendrocytes (doted arrows). (E,F) IBD group showed an increase in staining intensity in the above areas as compared to CPZ. Inset displayed the presence of some demyelinated nerve fibers (My) and oligodendrocytes (arrows). Strong myelin basic protein reaction of myelin fibers (My) and oligodendrocytes (arrows). (G,H) VA group showed moderate increase in staining intensity in the above areas as compared to the CPZ group. Inset displayed the presence of less demyelinated nerve fibers (My) and oligodendrocytes (arrows) from CC. Moderate myelin basic protein reaction of myelin fibers (My) and oligodendrocytes (arrows). (I,J) VA + IBD group showed strong blue staining intensity in the above areas. Inset displayed the presence of myelinated nerve fibers (My) and oligodendrocytes (arrows) from CC. Strong myelin basic protein reaction of myelin fibers (My) and oligodendrocytes (arrows). ML, molecular layer; PmL, pleomorphic layer; CA1, first part of cornu ammonis. (A,C,E,I) Luxol fast blue stain (LFB) × 200; (B,D,F,J) Myelin basic protein (MBP) × 200.

Similar articles

Cited by

References

    1. Alderbi R. M., Alshahrany G. A., Alyami K. A., Alsufiani H. M., Omar U. M., Al-Ghamdi M. A. (2022). Anti-inflammatory compounds ameliorate locomotion and anxiety behaviors in Cuprizone mouse model of multiple sclerosis. Mult. Scler. Relat. Disord. 59:103618. doi: 10.1016/j.msard.2022.103618, PMID: - DOI - PubMed
    1. Aldhahri R. S., Alghamdi B. S., Alzahrani N. A., Bahaidrah K. A., Alsufiani H. M., Mansouri R. A., et al. . (2022). Biochanin a improves memory decline and brain pathology in Cuprizone-induced mouse model of multiple sclerosis. Behav. Sci. 12:70. doi: 10.3390/bs12030070, PMID: - DOI - PMC - PubMed
    1. AlJumah M., Bunyan R., Al Otaibi H., Al Towaijri G., Karim A., Al Malik Y., et al. . (2020). Rising prevalence of multiple sclerosis in Saudi Arabia, a descriptive study. BMC Neurol. 20:49. doi: 10.1186/s12883-020-1629-3, PMID: - DOI - PMC - PubMed
    1. Al-Otaibi K. M., Alghamdi B. S., Al-Ghamdi M. A., Mansouri R. A., Ashraf G. M., Omar U. M. (2022). Therapeutic effect of combination vitamin D3 and siponimod on remyelination and modulate microglia activation in cuprizone mouse model of multiple sclerosis. Front. Behav. Neurosci. 16:1068736. doi: 10.3389/fnbeh.2022.1068736, PMID: - DOI - PMC - PubMed
    1. Amin F. U., Shah S. A., Kim M. O. (2017). Vanillic acid attenuates Abeta(1-42)-induced oxidative stress and cognitive impairment in mice. Sci. Rep. 7:40753. doi: 10.1038/srep40753, PMID: - DOI - PMC - PubMed

LinkOut - more resources