. 2025 Jan 23:16:20417314241284826.
doi: 10.1177/20417314241284826. eCollection 2025 Jan-Dec.

Oxygenation and function of endocrine bioartificial pancreatic tissue constructs under flow for preclinical optimization

Affiliations

Oxygenation and function of endocrine bioartificial pancreatic tissue constructs under flow for preclinical optimization

Brenden N Moeun et al. J Tissue Eng. .

Abstract

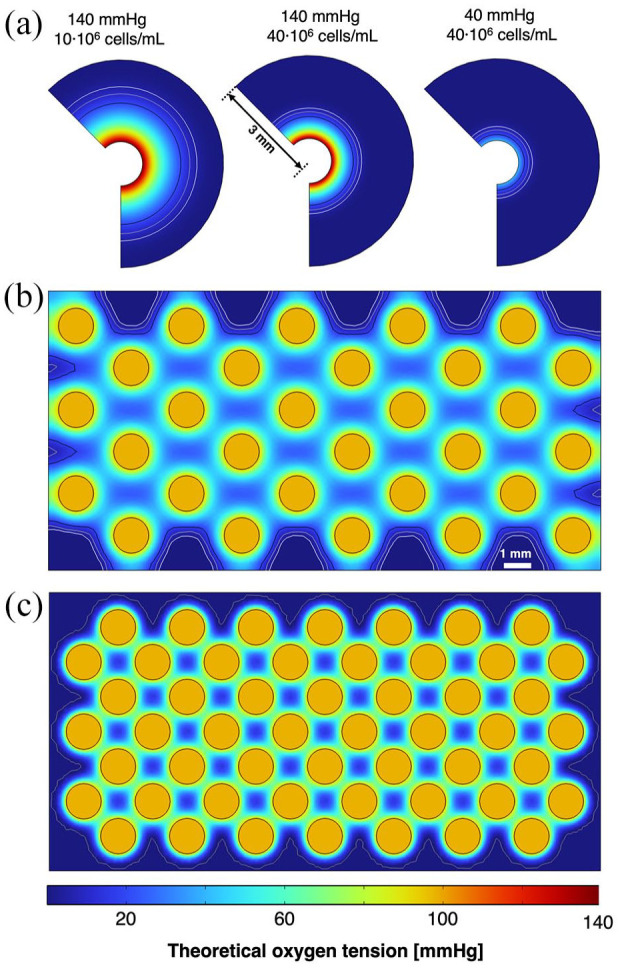
Islet transplantation and more recently stem cell-derived islets were shown to successfully re-establish glycemic control in people with type 1 diabetes under immunosuppression. These results were achieved through intraportal infusion which leads to early graft losses and limits the capacity to contain and retrieve implanted cells in case of adverse events. Extra-hepatic sites and encapsulation devices have been developed to address these challenges and potentially create an immunoprotective or immune-privileged environment. Many strategies have achieved reversal of hyperglycemia in diabetic rodents. So far, the results have been less promising when transitioning to humans and larger animal models due to challenges in oxygenation and insulin delivery. We propose a versatile in vitro perfusion system to culture and experimentally study the function of centimeter-scale tissues and devices for insulin-secreting cell delivery. The system accommodates various tissue geometries, experimental readouts, and oxygenation tensions reflective of potential transplantation sites. We highlight the system's applications by using case studies to explore three prominent bioartificial endocrine pancreas (BAP) configurations: (I) with internal flow, (II) with internal flow and microvascularized, and (III) without internal flow. Oxygen concentration profiles modeled computationally were analogous to viability gradients observed experimentally through live/dead endpoint measurements and in case I, time-lapse fluorescence imaging was used to monitor the viability of GFP-expressing cells in real time. Intervascular BAPs were cultured under flow for up to 3 days and BAPs without internal flow for up to 7 days, showing glucose-responsive insulin secretion quantified through at-line non-disruptive sampling. This system can complement other preclinical platforms to de-risk and optimize BAPs and other artificial tissue designs prior to clinical studies.

Keywords: Bioreactor; diabetes; oxygenation; perfusion; vascularization.


Conflict of interest statement

The author(s) declared no potential conflicts of interest with respect to the research, authorship, and/or publication of this article.

Figures

Figure 1.
Figure 1.
Flow device and perfusion system specifications: (a) General concept of flow device assembly. The base of the device holds a detachable tissue holder and a lid with integrated connectors encloses the flow chamber. A piece of glass covers the above-view imaging window and is kept in place with a bracket. (b) Cross-section of the flow device with red arrows indicating the general direction of flow. (c–g) Flow device parts and assembly after 3D printing. (h) Two assembled flow loops running inside of incubator. (i) Process flow diagram of the perfusion system. The flow device is connected to a vented reservoir, sampling port, and peristaltic pump via tubing and the system is placed within a cell incubator.
Figure 2.
Figure 2.
Computational flow dynamics (CFD) modeling of flow device chamber and case studies. (a–c) Empty flow chamber: (a) Longitudinal cross-section. (b) Angled view. (c) Shear stress profile on tissue holder walls. (d–f) Schematics of case studies: (d) BAP with internal flow (inlet flow rate was 8 mL/min); (e) BAP with internal flow and microvascularization (inlet flow rate was 4 mL/min); (f) BAP without internal flow (inlet flow rate was 4 mL/min). (g–i) Angled view of CFD models for each case study respectively. (j and l) Longitudinal cross section of CFD models for each case study respectively. (m–o) Shear stress profile for each case study respectively. For all CFD models, streamlines are shown in green.
Figure 3.
Figure 3.
Viability and function of artificial pancreatic tissues with internal flow (40 × 106 cells/mL starting density) after 2 days of perfusion culture: (a) Schematic of experimental setup: artificial pancreatic tissues are irrigated with two hollow channels and cultured under perfusion for 2 days. (b) Viability stain of a crosssection of one of the channels. Live cells are stained green (calcein-AM) and dead cells in red (propidium iodide). (c–e) Quantification of metabolites in perfusion medium samples that were periodically taken throughout the 2-day perfusion. Glucose, glutamine, and lactate concentrations are shown, respectively *p < 0.05. (f) Dynamic GSIS function of artificial pancreatic tissue after 2 days of perfusion culture (4 mL/min/channel). All error bars indicate the standard error of the mean (n = 3).
Figure 4.
Figure 4.
Real-time tracking of cell viability in pancreatic tissue constructs with internal flow (40 × 106 cells/mL starting density): (a) Schematic of experimental setup. (b) Above-view fluorescent images of a single-channel pancreatic tissue construct monitored over 48 h (scale bar: 5 mm). (c) Viability of a cross-section of the tissue construct with green indicating live cells and red marking dead cells (propidium iodide). (d) Quantification of fluorescent signal from the tissue construct over 48 h. The shaded area represents the standard error of the mean, n = 3.
Figure 5.
Figure 5.
Modeling the viability of BAPs with internal flow at different oxygenation conditions: (a) Schematic of the experimental setup: MIN6 constructs with internal flow with varying cell density are irrigated with two hollow channels and cultured under perfusion for 2 days under different oxygen tensions. (b) Viability stains of artificial tissue cross sections for one of the channels at varying cell density and oxygen tension. Going from left to right: 10 × 106 cells/mL and 140 mmHg, 40 × 106 cells/mL and 140 mmHg, 40 × 106 cells/mL and 40 mmHg. Live cells are stained green (calcein-AM) and dead cells in red (propidium iodide). (c) Quantification of the viability radius for each condition. **p < 0.01 and ***p < 0.001. (d) Computational model of each oxygenation condition. Visual models are placed in the same order as in (b). (e) Plot of theoretical oxygen concentration as a function of distance from the perfusion channel generated from the computational model. (f) Indication of the theoretical oxygen concentration corresponding to the measured viability radii in each condition. Error bars represent the standard error of the mean, n = 3.
Figure 6.
Figure 6.
Scaffold with insulin-producing cells within the flow device: (a) Schematic of two polycaprolactone scaffolds were placed in the tissue holder of the flow chamber system. These porous scaffolds contained endothelial cells and adipose-derived stromal cells. In addition, two channels were incorporated for medium flow and one channel for the MIN6 insulin-producing aggregates (0.25 × 106 aggregates/mL). (b) Live/dead staining after 3 days of perfusion culture. Left panel: sectioned scaffold showing a MIN6 aggregate (white arrow) and surrounding HUVEC cells. Right panel: HUVECs at the surface of a scaffold. (c) H&E staining of scaffolds. Top row: scaffold cores. Middle row: scaffold edges. Bottom row: scaffold cores. (d and e) Glucose-stimulated insulin secretion test conducted after 3 days of culture: (d) dynamic and (e) static. The mean and standard error of the mean are plotted, n = 3.
Figure 7.
Figure 7.
Viability and function of 3D bioprinted pancreatic tissue constructs: (a) Schematic of culturing constructs under flow. Bioprinted fibers are held within the flow field using a custom cage fitted within the tissue holder. (b) Viability stain of MIN6 aggregates after 7 days of culture within the perfusion system. (c–e) Quantification of metabolites in medium samples that were periodically taken after 1, 3, and 5 days of culture under flow. Arrows indicate complete reservoir medium changes (days 2 and 4). Glucose, glutamine, and lactate concentrations are shown, respectively. (f) Dynamic GSIS function of MIN6 aggregates after 1 and 7 days of culture within the perfusion system (300 single MIN6 cells per aggregates; 88,000 aggregates/mL alginate). The mean and standard error of the mean are plotted, n = 3.
Figure 8.
Figure 8.
Analysis of the theoretical viability radius in perfusable BAPs containing islet cells and MIN6: (a) Computational model of theoretical cross sections for BAPs containing islet cells at varying cell density and oxygen tension. Going from left to right: 10 × 106 cells/mL and 140 mmHg, 40 × 106 cells/mL and 140 mmHg, 40 × 106 cells/mL and 40 mmHg. (b and c) Theoretical oxygen tension of perfusable BAPs (40 × 106 cells/mL) within the largest cross section possible in our current perfusion system. The oxygen tension within the perfusate was set to arterial levels (100 mmHg). Channels are arranged in a simple array by way of maximizing the viable area. (b) With human islet cells: black, brown, and white contours indicate oxygen tensions of 20, 10, and 5 mmHg which have been reported as the minimal oxygen tension required for islet cell survival. (c) With MIN6 cells: the contour line indicates an oxygen tension of 1 mmHg.

Similar articles

Cited by

References

    1. Gregory GA, Robinson TI, Linklater SE, et al.. Global incidence, prevalence, and mortality of type 1 diabetes in 2021 with projection to 2040: a modelling study. Lancet Diabetes Endocrinol 2022; 10: 741-760. - PubMed
    1. Latres E, Finan DA, Greenstein JL, et al.. Navigating two roads to glucose normalization in diabetes: automated insulin delivery devices and cell therapy. Cell Metab 2019; 29: 545–563. - PubMed
    1. Lablanche S, Vantyghem M-C, Kessler L, et al.. Islet transplantation versus insulin therapy in patients with type 1 diabetes with severe hypoglycaemia or poorly controlled glycaemia after kidney transplantation (TRIMECO): a multicentre, randomised controlled trial. Lancet Diabetes Endocrinol 2018; 6: 527–537. - PubMed
    1. Tomic D, Shaw JE, Magliano DJ. The burden and risks of emerging complications of diabetes mellitus. Nat Rev Endocrinol 2022; 18: 525–539. - PMC - PubMed
    1. Simeone JC, Shah S, Ganz ML, et al.. Healthcare resource utilization and cost among patients with type 1 diabetes in the United States. J Manag Care Spec Pharm 2020; 26: 1399–1410. - PMC - PubMed

LinkOut - more resources