

Cost-Effectiveness and Clinical Outcomes of Controlled Ovarian Stimulation With Follitropin Delta and Follitropin Alfa: A Retrospective Study
- PMID: 39867102
- PMCID: PMC11759662
- DOI: 10.7759/cureus.76371
Cost-Effectiveness and Clinical Outcomes of Controlled Ovarian Stimulation With Follitropin Delta and Follitropin Alfa: A Retrospective Study
Abstract
Aim: This study compared the cost-effectiveness of two recombinant follicle-stimulating hormones (rFSH) formulations, Follitropin Delta and Follitropin Alfa, in controlled ovarian stimulation using cumulative live birth rates as an efficacy indicator.
Methodology: This retrospective study was conducted across five clinics in Japan from April 2022 to December 2023, involving 446 first assisted reproductive technology (ART) cycles (200 with Follitropin Delta and 246 with Follitropin Alfa) were treated with rFSH monotherapy using either Follitropin Delta or Follitropin Alfa. We compared clinical outcomes such as cumulative pregnancy and live birth rates and analyzed cost-effectiveness using the cumulative live birth rates as the efficacy indicator and the incremental cost-effectiveness ratio (ICER).
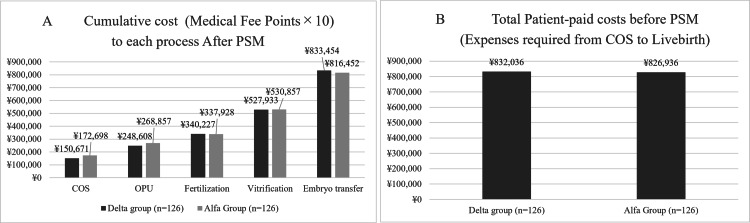
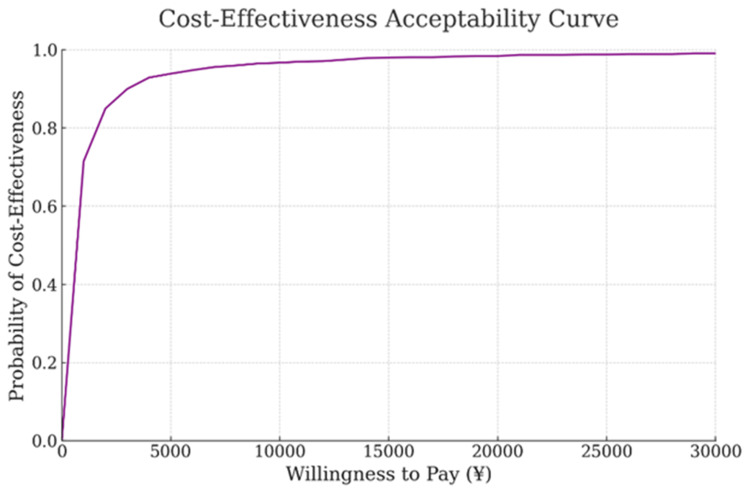
Results: The Follitropin Delta group had a significantly lower incidence of ovarian hyperstimulation syndrome (15.90% vs. 27.00%, P = 0.045) and higher cumulative pregnancy rates than the Follitropin Alfa group (87.30% vs. 76.20 %; P = 0.03) after propensity score matching (PSM). Although cumulative live birth rates showed no significant differences (85.70% vs. 76.20%, P = 0.08) and Follitropin Delta demonstrated higher cost than Follitropin AlfaFollitropin Alfa (832,036 yen and 826,936 yen), ICER indicated low costs per percentage of live births (538.58 yen/%: 95% confidence interval [CI]: 275.34-12,568.69 yen).
Conclusions: Using Follitropin Delta for controlled ovarian stimulation in ART may be more cost-effective than Follitropin Alfa under Japan's Health Care Insurance System, offering higher cumulative live birth rates and minimal additional costs.
Keywords: cost effectiveness; cumulative live birth rate; follitropin alfa; follitropin delta; incremental cost-effectiveness ratio (icer).
Copyright © 2024, Kobanawa et al.
Conflict of interest statement
Human subjects: Consent for treatment and open access publication was obtained or waived by all participants in this study. The Medical Corporation Kobanawa Clinic Ethic Screening Committee issued approval 20231211. Animal subjects: All authors have confirmed that this study did not involve animal subjects or tissue. Conflicts of interest: In compliance with the ICMJE uniform disclosure form, all authors declare the following: Payment/services info: We would like to sincerely thank Ferring Pharmaceuticals for the generous financial support through an Investigator-Initiated Clinical Research Agreement that made this study possible. Financial relationships: All authors have declared that they have no financial relationships at present or within the previous three years with any organizations that might have an interest in the submitted work. Other relationships: All authors have declared that there are no other relationships or activities that could appear to have influenced the submitted work.
Figures


Similar articles
-
Controlled ovarian stimulation (COS) with follitropin delta results in higher cumulative live birth rates compared with follitropin alfa/beta in a large retrospectively analyzed real-world data set.Reprod Biol Endocrinol. 2025 Feb 20;23(1):25. doi: 10.1186/s12958-025-01364-5. Reprod Biol Endocrinol. 2025. PMID: 39980039 Free PMC article.
-
A randomised controlled trial to clinically validate follitropin delta in its individualised dosing regimen for ovarian stimulation in Asian IVF/ICSI patients.Hum Reprod. 2021 Aug 18;36(9):2452-2462. doi: 10.1093/humrep/deab155. Hum Reprod. 2021. PMID: 34179971 Free PMC article. Clinical Trial.
-
The cumulative live birth rate of recombinant follicle-stimulating hormone alfa verse urinary human follicle-stimulating hormone for ovarian stimulation in assisted reproductive technology cycles.J Ovarian Res. 2022 Jun 21;15(1):74. doi: 10.1186/s13048-022-01009-w. J Ovarian Res. 2022. PMID: 35729654 Free PMC article.
-
Biosimilar recombinant follitropin alfa preparations versus the reference product (Gonal-F®) in couples undergoing assisted reproductive technology treatment: a systematic review and meta-analysis.Reprod Biol Endocrinol. 2021 Apr 2;19(1):51. doi: 10.1186/s12958-021-00727-y. Reprod Biol Endocrinol. 2021. PMID: 33794909 Free PMC article.
-
Originator recombinant human follitropin alfa versus recombinant human follitropin alfa biosimilars in Spain: A cost-effectiveness analysis of assisted reproductive technology related to fresh embryo transfers.Best Pract Res Clin Obstet Gynaecol. 2022 Dec;85(Pt B):203-216. doi: 10.1016/j.bpobgyn.2022.01.011. Epub 2022 Feb 8. Best Pract Res Clin Obstet Gynaecol. 2022. PMID: 35227619 Review.
Cited by
-
Secretory Profile Analysis of Human Granulosa Cell Line Following Gonadotropin Stimulation.Int J Mol Sci. 2025 Apr 25;26(9):4108. doi: 10.3390/ijms26094108. Int J Mol Sci. 2025. PMID: 40362347 Free PMC article.
-
Ovarian Responses and Outcomes of In Vitro Fertilization Following Progesterone-Primed Ovarian Stimulation and Gonadotropin-Releasing Hormone (GnRH) Antagonist Protocols Using Follitropin Delta.Cureus. 2025 Jun 4;17(6):e85341. doi: 10.7759/cureus.85341. eCollection 2025 Jun. Cureus. 2025. PMID: 40469889 Free PMC article.
References
-
- Different pharmacokinetic and pharmacodynamic properties of recombinant follicle-stimulating hormone (rFSH) derived from a human cell line compared with rFSH from a non-human cell line. Olsson H, Sandström R, Grundemar L. J Clin Pharmacol. 2014;54:1299–1307. - PubMed
-
- Genetic engineering of human FSH (Gonal-F) Howles CM. Hum Reprod Update. 1996;2:172–191. - PubMed
-
- Cumulative live birth rate: time for a consensus? Maheshwari A, McLernon D, Bhattacharya S. Hum Reprod. 2015;30:2703–2707. - PubMed
LinkOut - more resources
Full Text Sources
Miscellaneous