. 2025 Jan 9;26(1):25055.
doi: 10.31083/RCM25055. eCollection 2025 Jan.

Association of Immune Nutrition Indices with the Risk of All-Cause Mortality and Cardiovascular Mortality in Patients with Heart Failure in the NHANES (1999-2018)

Affiliations

Association of Immune Nutrition Indices with the Risk of All-Cause Mortality and Cardiovascular Mortality in Patients with Heart Failure in the NHANES (1999-2018)

Feifei Zhang et al. Rev Cardiovasc Med. .

Abstract

Background: Heart failure (HF) remains a global challenge with disappointing long-term outcomes. Malnutrition is prevalent in patients with HF and disrupts the equilibrium of immune and inflammatory responses, resulting in further deterioration of the HF. Novel indicators emerge as immune nutrition indices, including the prognostic nutritional index (PNI), neutrophil-to-lymphocyte ratio (NLR), Controlling Nutritional Status (CONUT) score, and cholesterol-modified prognostic nutritional index (CPNI). This study examines the correlation between immune nutrition indices and all-cause and cardiovascular mortality in patients with HF.

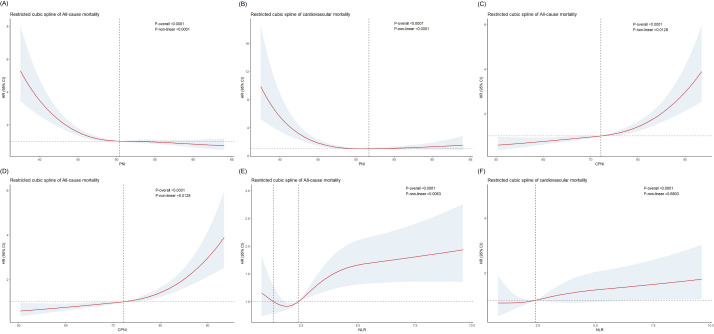
Methods: The data source for this study was the National Health and Nutrition Examination Survey (NHANES). A total of 1232 participants with HF were included. Weighted Cox proportional hazards models were employed to assess the independent association of different immune nutrition indices with mortality risk, alongside subgroup analyses and Kaplan-Meier survival curves. Restricted cubic spline analysis was utilized to clarify the detailed association between immune nutrition indices and hazard ratio (HR). A time-dependent receiver operating characteristic curve analysis was conducted to assess the predictive ability.

Results: After full adjustments, PNI is independently related to all-cause mortality (HR = 0.94, 95% CI: 0.92-0.97) and cardiovascular mortality (HR = 0.94, 95% CI: 0.90-0.99). CPNI, CONUT, and NLR also showed an independent association with the prognosis of HF. Time-dependent receiver operating characteristic curve analysis indicated that PNI exhibited the highest predictive power for mortality among the CPNI, CONUT, and NLR indexes.

Conclusions: Our study revealed that immune nutrition indicators, including CPNI, could predict all-cause mortality and cardiovascular mortality in the HF population. Compared with other indicators, PNI is the most effective predictor.

Keywords: all-cause mortality; cardiovascular mortality; heart failure; immune; inflammatory; nutrition.


Conflict of interest statement

The authors declare no conflict of interest.

Figures

Fig. 1.
Fig. 1.
Flowchart of the selection criteria for participants. NHANES, National Health and Nutrition Examination Survey; PNI, prognostic nutritional index; CPNI, cholesterol-modified prognostic nutritional index; NLR, neutrophil-to-lymphocyte ratio; CONUT, controlling nutritional status.
Fig. 2.
Fig. 2.
Restricted cubic spline regression analysis. (A,C,E) Non-linear relationship between PNI, CPNI, NLR, and all-cause mortality. (B,D) Non-linear relationship between PNI, CPNI, and cardiovascular mortality. (F) The linear relationship between NLR and cardiovascular mortality. Adjusted for age, gender, race, marriage, education, PIR group, BMI, SBP, DBP, smoke, asthma, anemia, CHD, stroke, cancer, hypertension, diabetes, HbA1c, triglycerides, total cholesterol, uric acid, eGFR, iron, sodium, potassium, neutrophils, monocytes, hemoglobin, and platelets. PNI, prognostic nutritional index; CPNI, cholesterol-modified prognostic nutritional index; NLR, neutrophil-to-lymphocyte ratio; PIR, poverty income ratio; BMI, body mass index; SBP, systolic blood pressure; DBP, diastolic blood pressure; CHD, coronary heart disease; HbA1c, hemoglobin A1c; eGFR, estimated glomerular filtration rate.
Fig. 3.
Fig. 3.
Kaplan–Meier survival curve. (A–D) Kaplan–Meier survival curve for all-cause mortality in populations with different PNI, CPNI, NLR, and CONUT levels. (E–H) Kaplan–Meier survival curve for cardiovascular mortality in populations with different PNI, CPNI, NLR, and CONUT levels. PNI, prognostic nutritional index; CPNI, cholesterol-modified prognostic nutritional index; NLR, neutrophil-to-lymphocyte ratio; CONUT, controlling nutritional status.
Fig. 4.
Fig. 4.
Time-dependent ROC analysis. (A,C,E,G) Time-dependent ROC analysis for all-cause mortality using PNI, CPNI, NLR, and CONUT in HF populations. (B,D,F,H) Time-dependent ROC analysis for cardiovascular mortality using PNI, CPNI, NLR, and CONUT in HF populations. HF, heart failure; PNI, prognostic nutritional index; CPNI, cholesterol-modified prognostic nutritional index; NLR, neutrophil-to-lymphocyte ratio; CONUT, controlling nutritional status; ROC, receiver operating characteristic curve; AUC, area under the curve.
Fig. 5.
Fig. 5.
The relationships of immune nutrition indicators mortality in HF populations. (A) The prognostic ability comparison of PNI, CPNI, NLR, and CONUT for all-cause mortality in HF populations. (B) The prognostic ability comparison of PNI, CPNI, NLR, and CONUT for cardiovascular mortality in HF populations. HF, heart failure; PNI, prognostic nutritional index; CPNI, cholesterol-modified prognostic nutritional index; NLR, neutrophil-to-lymphocyte ratio; CONUT, controlling nutritional status; AUC, area under the curve.
Fig. 6.
Fig. 6.
Subgroup analysis and interaction analysis. (A) Subgroup analysis for all-cause mortality. (B) Subgroup analysis for cardiovascular mortality. Adjusted for age, gender, race, marriage, education, PIR group, BMI, SBP, DBP, smoke, asthma, anemia, CHD, stroke, cancer, hypertension, diabetes, HbA1c, triglycerides, total cholesterol, uric acid, eGFR, iron, sodium, potassium, neutrophils, monocytes, hemoglobin, and platelets. PIR, poverty income ratio; CHD, coronary heart disease; HR, hazard ratio; BMI, body mass index; SBP, systolic blood pressure; DBP, diastolic blood pressure; HbA1c, hemoglobin A1c; eGFR, estimated glomerular filtration rate.

Similar articles

Cited by

References

    1. Walia RS, Mankoff R. Impact of Socioeconomic Status on Heart Failure. Journal of Community Hospital Internal Medicine Perspectives . 2023;13:107–111. - PMC - PubMed
    1. Driggin E, Cohen LP, Gallagher D, Karmally W, Maddox T, Hummel SL, et al. Nutrition Assessment and Dietary Interventions in Heart Failure: JACC Review Topic of the Week. Journal of the American College of Cardiology . 2022;79:1623–1635. - PMC - PubMed
    1. Davran GB, Davran AÇ, Karabag T. The relationship of prognostic nutritional index with prognosis and inflammation in patient with heart failure and reduced ejection fraction. Nutrition and Health . 2023;29:737–743. - PubMed
    1. Xu JP, Zeng RX, Zhang YZ, Lin SS, Tan JW, Zhu HY, et al. Systemic inflammation markers and the prevalence of hypertension: A NHANES cross-sectional study. Hypertension Research . 2023;46:1009–1019. - PubMed
    1. Ren J, Wang XY, Sun Y. Neutrophil-Lymphocyte Ratio Can be Used as a Predictor of Prognosis in Patients With Heart Failure. Angiology . 2023;33197231201927. - PubMed

LinkOut - more resources