Chondroitin Sulphate-Chitosan Based Nanogels Loaded with Naringenin-β-Cyclodextrin Complex as Potential Tool for the Treatment of Diabetic Retinopathy: A Formulation Study
- PMID: 39867306
- PMCID: PMC11766310
- DOI: 10.2147/IJN.S488507
Chondroitin Sulphate-Chitosan Based Nanogels Loaded with Naringenin-β-Cyclodextrin Complex as Potential Tool for the Treatment of Diabetic Retinopathy: A Formulation Study
Abstract
Purpose: The main purpose of the study was the formulation development of nanogels (NHs) composed of chondroitin sulfate (CS) and low molecular weight chitosan (lCH), loaded with a naringenin-β-cyclodextrin complex (NAR/β-CD), as a potential treatment for early-stage diabetic retinopathy.
Methods: Different formulations of NHs were prepared by varying polymer concentration, lCH ratio, and pH and, then, characterized for particle size, zeta potential, particle concentration (particles/mL) and morphology. Cytotoxicity and internalization were assessed in vitro using Human Umbilical Vein Endothelial Cells (HUVEC). The NAR/β-CD complex was prepared and evaluated for morphology, complexation efficiency, and solubility. Finally, the most promising NH prototype was loaded with NAR/β-CD (NH@NAR/β-CD) and further characterized for encapsulation efficiency, loading capacity, opacity and cytotoxicity on HUVEC; in vitro release test and DPPH assay were performed to investigate NH capability to sustain NAR release and NH@NAR/β-CD antioxidant properties, respectively.
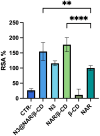
Results: NH properties were influenced by polymer concentration, lCH ratio, and pH. N3 (0.5 mg/mL; lCH=1.5:1; pH = 5) and N9 (0.5 mg/mL; lCH=1:1; pH = 5) showed optimal characteristics, including small size (<350 nm) and positive zeta potential, facilitating cellular uptake. The NAR/β-CD complex showed 71% complexation efficiency and enhanced NAR solubility. Since characterized by superior properties and better in vitro biocompatibility, N3 was loaded with NAR/β-CD. N3@NAR/β-CD capability to sustain in vitro NAR release, radical scavenging activity and in vitro biocompatibility were finally demonstrated.
Conclusion: The physico-chemical properties of N3@NAR/β-CD were responsible for their cell uptake, suggesting their potential to target retinal endothelial cells. The high NAR/β-CD complexation efficiency and the sustained NAR release over 72 hours could guarantee the maintenance of an effective drug concentration at the damage site while reducing the injection number. Further studies about the safety and the effectiveness of the intravitreal injection of NHs@NAR/β-CD will be performed on a diabetic animal model.
Keywords: antioxidant properties; cellular uptake; inclusion complex; intravitreal administration; polyelectrolyte complexation.
© 2025 Zucca et al.
Conflict of interest statement
The authors declare that they have no known competing financial interests or personal relationships that could have appeared to influence the work reported in this work.
Figures


Similar articles
-
Preparation and evaluation of naringenin-loaded sulfobutylether-β-cyclodextrin/chitosan nanoparticles for ocular drug delivery.Carbohydr Polym. 2016 Sep 20;149:224-30. doi: 10.1016/j.carbpol.2016.04.115. Epub 2016 Apr 28. Carbohydr Polym. 2016. PMID: 27261746
-
Antioxidant studies of chitosan nanoparticles containing naringenin and their cytotoxicity effects in lung cancer cells.Int J Biol Macromol. 2015;78:87-95. doi: 10.1016/j.ijbiomac.2015.03.045. Epub 2015 Apr 1. Int J Biol Macromol. 2015. PMID: 25840152
-
The preparation of casein-chitosan based naringin nanoparticles and their therapeutic application against Pseudomonas aeruginosa-induced pneumonia.Int J Biol Macromol. 2024 Dec;283(Pt 1):137133. doi: 10.1016/j.ijbiomac.2024.137133. Epub 2024 Nov 12. Int J Biol Macromol. 2024. PMID: 39537072
-
The Systems of Naringenin with Solubilizers Expand Its Capability to Prevent Neurodegenerative Diseases.Int J Mol Sci. 2022 Jan 11;23(2):755. doi: 10.3390/ijms23020755. Int J Mol Sci. 2022. PMID: 35054939 Free PMC article.
-
Chitosan Oligosaccharide Modified Bovine Serum Albumin Nanoparticles for Improving Oral Bioavailability of Naringenin.Curr Drug Deliv. 2024;21(8):1142-1150. doi: 10.2174/1567201820666230718143726. Curr Drug Deliv. 2024. PMID: 37464826
Cited by
-
Chitosan-Based Gel Development: Extraction, Gelation Mechanisms, and Biomedical Applications.Gels. 2025 Apr 6;11(4):275. doi: 10.3390/gels11040275. Gels. 2025. PMID: 40277711 Free PMC article. Review.
-
Flavonoid-Based Nanogels: A Comprehensive Overview.Gels. 2025 Apr 4;11(4):267. doi: 10.3390/gels11040267. Gels. 2025. PMID: 40277705 Free PMC article. Review.
-
The Transformative Role of Nanotechnology in the Management of Diabetes Mellitus: Insights from Current Research.Biomolecules. 2025 May 1;15(5):653. doi: 10.3390/biom15050653. Biomolecules. 2025. PMID: 40427546 Free PMC article. Review.
-
Exploration of the potential therapeutic benefits of naringenin against diabetic retinopathy through a National comprehensive cross-sectional study and in vitro experiments.Diabetol Metab Syndr. 2025 Aug 1;17(1):304. doi: 10.1186/s13098-025-01879-2. Diabetol Metab Syndr. 2025. PMID: 40751167 Free PMC article.
References
-
- Diabetes: health topics of the world health organization. Available from: https://www.who.int/health-topics/diabetes#tab=tab_1. Accessed January 8, 2024.
MeSH terms
Substances
LinkOut - more resources
Full Text Sources
Medical

