. 2025 Jan 24;15(4):2416-2429.
doi: 10.1039/d4ra07256a. eCollection 2025 Jan 23.

Red-shifted optical absorption induced by donor-acceptor-donor π-extended dibenzalacetone derivatives

Affiliations

Red-shifted optical absorption induced by donor-acceptor-donor π-extended dibenzalacetone derivatives

Vitória M R Vasconcelos et al. RSC Adv. .

Abstract

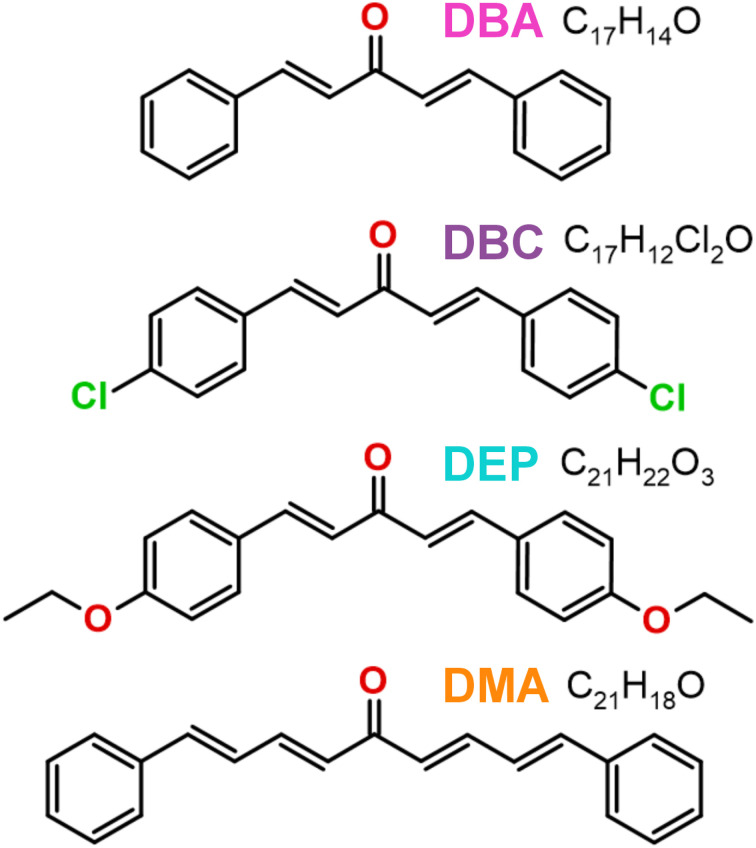
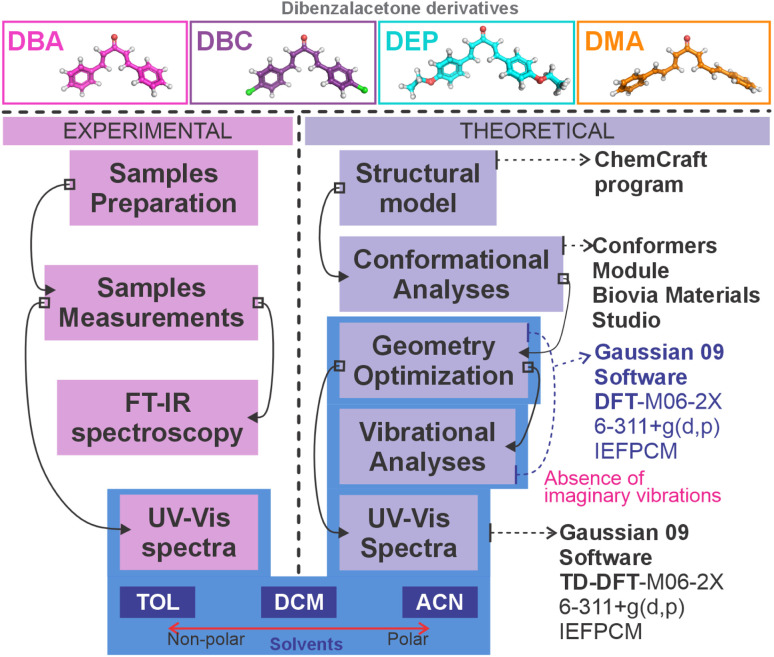
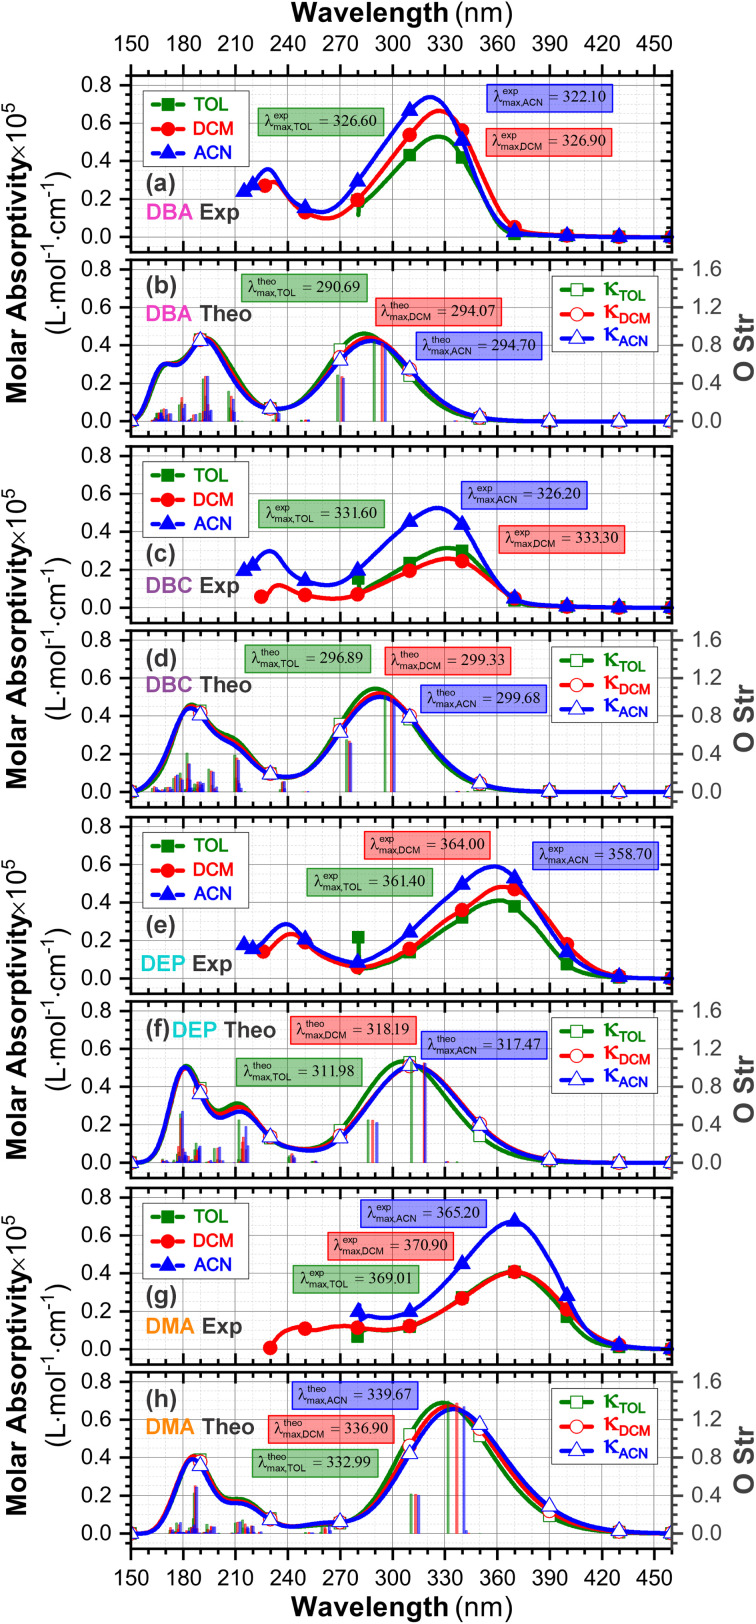
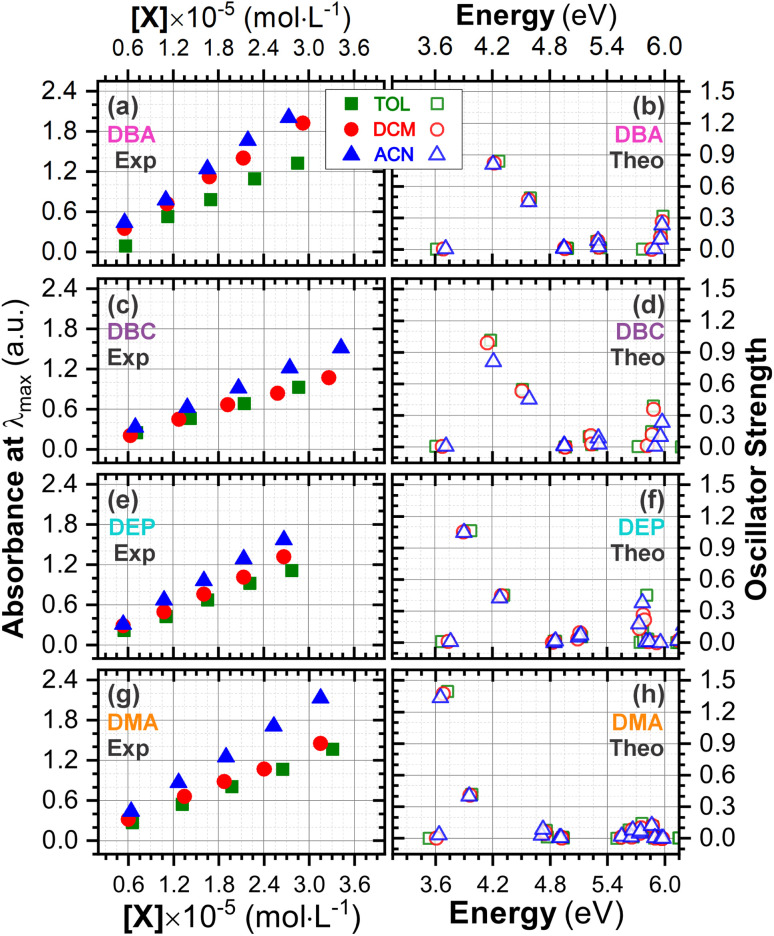
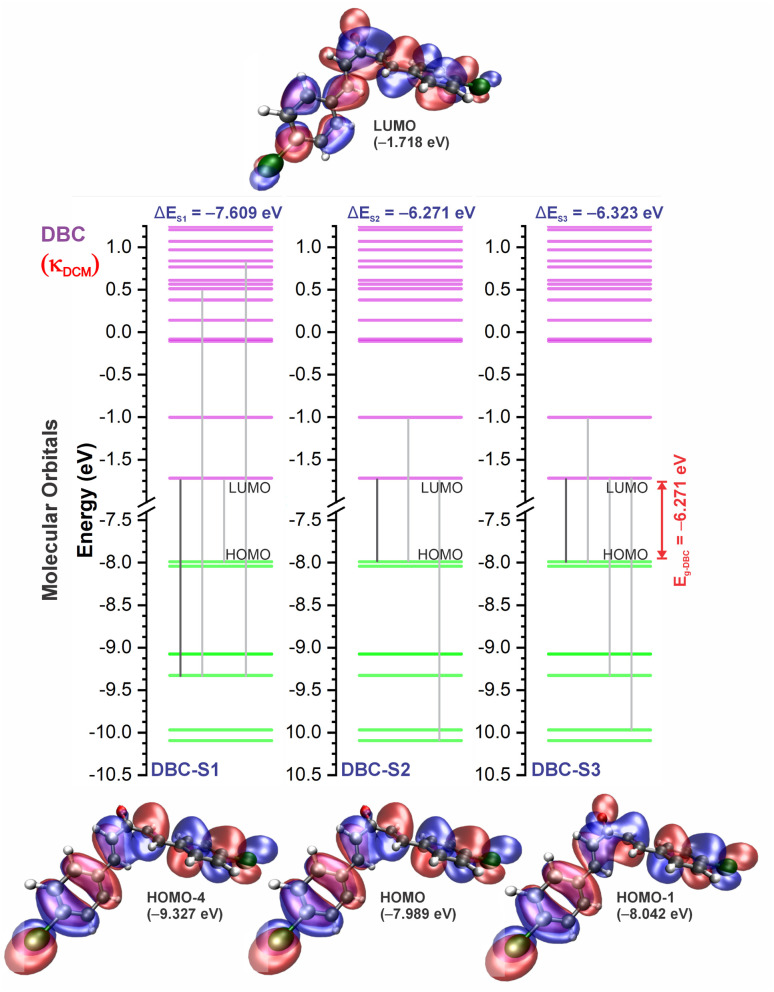
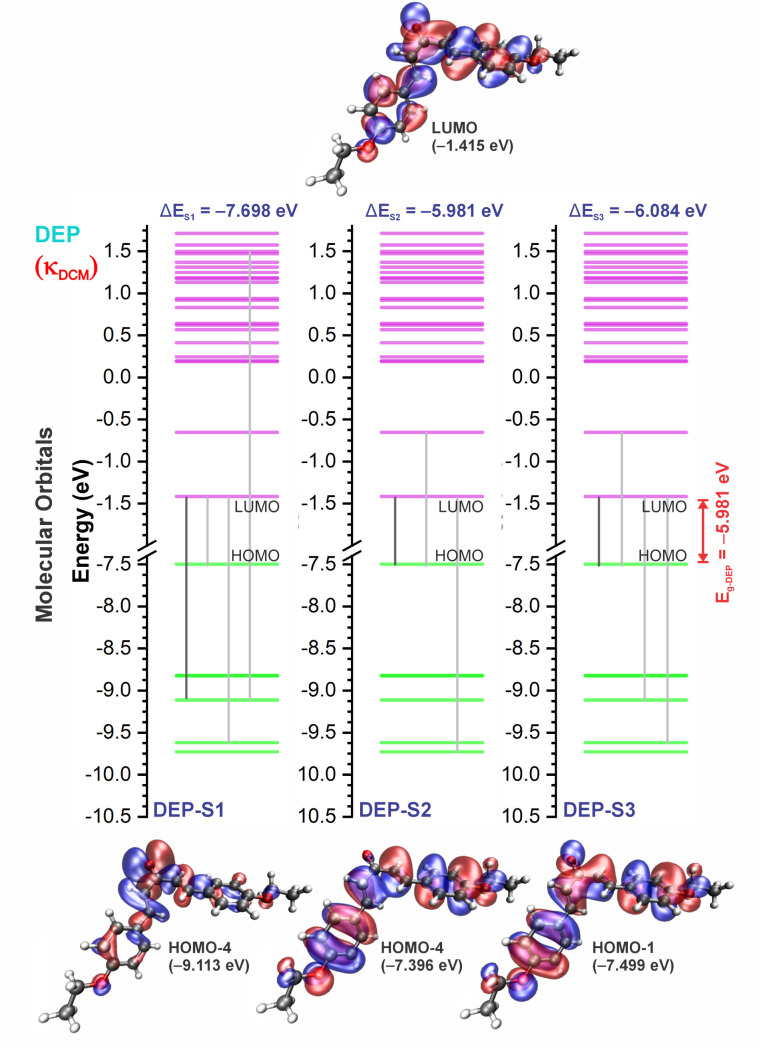
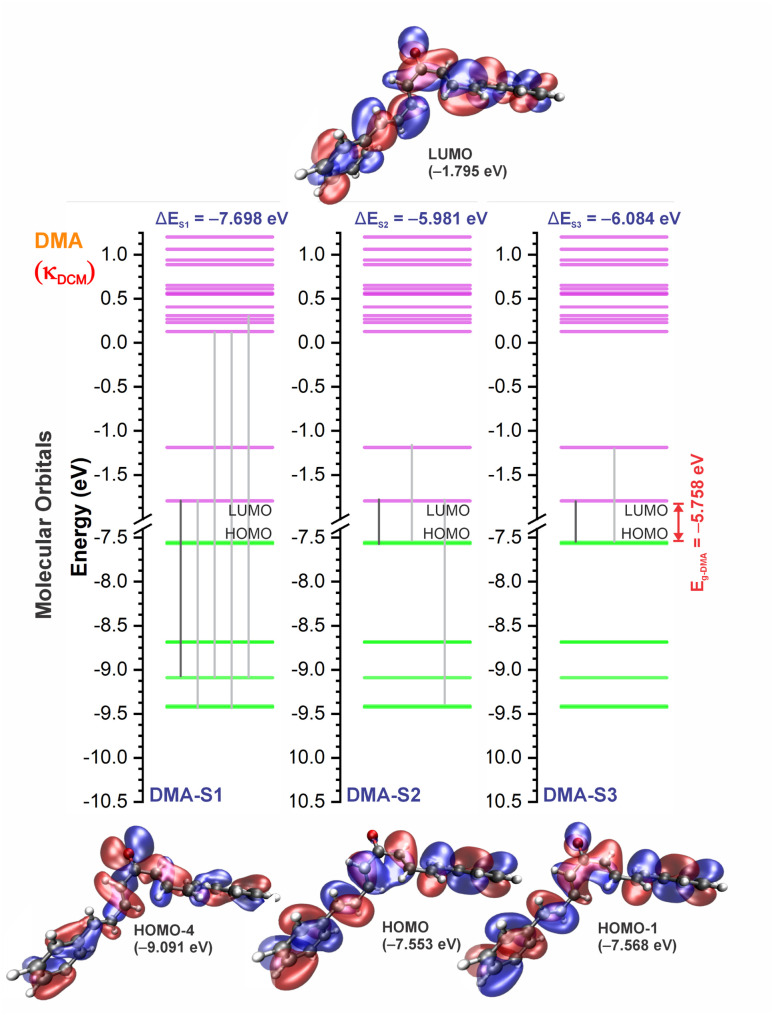
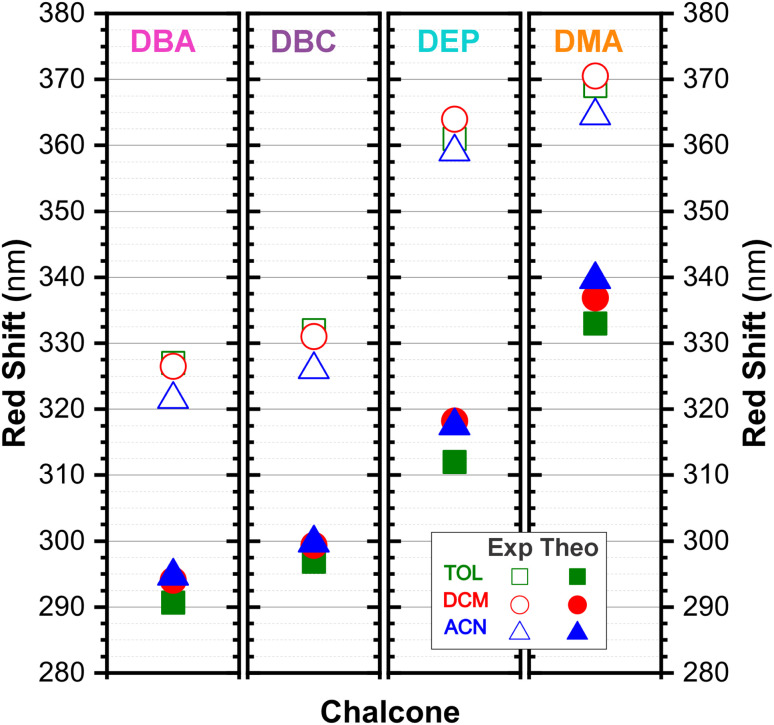
Chalcones demonstrate significant absorption in the near ultraviolet-visible spectrum, making them valuable for applications such as solar cells, light-emitting diodes, and nonlinear optics. This study investigates four dibenzalacetone derivatives (DBAd), DBA, DBC, DEP, and DMA, examining the impact of electron-donating and electron-withdrawing groups and conjugation elongation on their electronic structure in solvents of varying polarities. Using the Polarizable Continuum Model (PCM) and time-dependent density functional theory (TD-DFT), we characterized the excited states of these compounds. Our results reveal a consistent red-shift in the absorption spectrum, with electron-donating groups like ethoxy inducing a more pronounced red-shift than chlorine. Extending conjugation in DMA further shifted the absorption band to lower energy. Solvatochromism influenced the absorption intensities, underscoring the importance of evaluating parameters beyond λ max. Although our methodologies provided a satisfactory correlation between theoretical and experimental data, they also indicate the need for further theoretical models to accurately capture solute-solvent interactions and describe charge-separated states. The results indicated that dibenzalacetone derivatives have potential as alternative materials for development of organic solar cells.


Conflict of interest statement

There are no conflicts to declare.

Figures

Fig. 1
Fig. 1. Two-dimensional chemical structures of the four dibenzalacetone derivatives (DBAd): DBA (C17H14O), DBC (C17H12Cl2O), DEP (C21H22O3), and DMA (C21H18O). Carbons and hydrogens are not explicitly shown. Non-carbon and non-hydrogen atoms are colored by atom type (oxygen in red, chloride in green). The figure was drawn using ChemCraft program (graphical software for visualization of quantum chemistry computations https://www.chemcraftprog.com).
Fig. 2
Fig. 2. The experimental and computational protocol employed to obtain the UV-vis spectra and electronic properties of the four dibenzalacetone derivatives (DBAd) – DBA, DBC, DEP, and DMA – (presented in Fig. 1) in the toluene (TOL), dichloromethane (DCM), and acetonitrile (ACN) solvents. The experimental protocol (left side) is pink, and the theoretical protocol (right) is purple. Solvents (bottom) are represented in blue, and methods that used solvents are shaded in light blue.
Fig. 3
Fig. 3. Optimized dibenzalacetone derivatives (DBAd) using the DFT method with functional M06-2X and 6-311+G(d,p) basis sets. Superposition image of ball and stick representations of all four DBAd (top), followed by representations of DBA (C17H14O), DBC (C17H12Cl2O), DEP (C21H22O3), and DMA (C21H18O) with atom labels. The carbons of each of the DBAd are colored differently (DBA in pink balls, DBC in purple balls, DEP in cyan balls, and DMA in orange balls), while non-carbon atoms are colored by atom type (oxygen in red, chloride in green, and hydrogen in light grey). The atom labels referring to hydrogen atoms were suppressed. The figure was drawn using PyMOL (PyMOL Molecular Graphics System; http://www.pymol.org).
Fig. 4
Fig. 4. Experimental FT-IR vibrational spectra and theoretical spectra were calculated using the DFT methodology with M06-2X/6-311+G(d,p) in dichloromethane (DCM) using the IEFPCM implicit solvent method. Experimental spectra (red line) are shown for (a) DBA, (c) DBC, (e) DEP, and (g) DMA. Gaussian fits were applied to the theoretical spectra (colored lines) for (b) DBA (pink line), (d) DBC (purple line), (f) DEP (light blue line), and (h) DMA (orange line). IR modes are presented in the spectral ranges of 300–1199 (left), 1150–1900 (middle), and 2800–3600 cm−1 (right). Infrared intensity is presented in arbitrary units (a.u.).
Fig. 5
Fig. 5. Experimental (a, c, e and g) and theoretical (b, d, f and h) UV-vis absorption spectra of DBA, DBC, DEP, and DMA, respectively, across a range of wavelengths from 150 to 460 nm, and oscillator force (right axis), using the DFT methodology with the M06-2X functional, 6-311+G(d,p) basis set, and three solvents, toluene (κTOL = 2.37), dichloromethane (κDCM = 8.93) and acetonitrile (κACN = 35.67) with the implicit solvent method IEFPCM. The vertical lines represent the oscillator strengths, indicating the relative probability of the leading electronic transitions (singlet–singlet) for the lowest-energy excited states.
Fig. 6
Fig. 6. Determination of molar absorption coefficients for DBA (a), DBC (c), DEP (e) and DMA (g) in toluene (κTOL = 2.37), dichloromethane (κDMC = 8.93) and acetonitrile (κACN = 35.67) by linear regression analysis of the experimental data of maximum absorption as a function of molar concentration, according to the Beer–Lambert law. The results on the y-axis, initially described in arbitrary units, were corrected to mole per L per cm−1 to standardize the interpretation with the theoretical results and can be found in Table S2 in the ESI. Theoretical oscillator strengths as a function of photon energy (in eV) for DBA (b), DBC (d), DEP (f) and DMA (h) in TOL, DCM, and ACN.
Fig. 7
Fig. 7. Molecular orbital diagram for the excited states (S1, S2, and S3) and frontier orbital isosurfaces for DBA in dichloromethane (κDCM = 8.93). The isosurfaces are displayed with contour values of +0.015 (blue) and −0.015 (red). The solvents toluene (κTOL = 2.37) and acetonitrile (κACN = 35.67) involve very similar frontier orbitals, which are not repeated here. κ is the dielectric constant of the solvent.
Fig. 8
Fig. 8. Molecular orbital diagram for the excited states (S1, S2, and S3) and frontier orbital isosurfaces for DBC in dichloromethane (κDCM = 8.93). The isosurfaces are displayed with contour values of +0.015 (blue) and −0.015 (red). The solvents toluene (κTOL = 2.37) and acetonitrile (κACN = 35.67) involve very similar frontier orbitals, which are not repeated here. κ is the dielectric constant of the solvent.
Fig. 9
Fig. 9. Molecular orbital diagram for the excited states (S1, S2, and S3) and frontier orbital isosurfaces for DEP in dichloromethane (κDCM = 8.93). The isosurfaces are displayed with contour values of +0.015 (blue) and −0.015 (red). The solvents toluene (κTOL = 2.37) and acetonitrile (κACN = 35.67) involve the very similar frontier orbitals, which are not repeated here. κ is the dielectric constant of the solvent.
Fig. 10
Fig. 10. Molecular orbital diagram for the excited states (S1, S2, and S3) and frontier orbital isosurfaces for DMA in dichloromethane (κDCM = 8.93). The isosurfaces are displayed with contour values of +0.015 (blue) and −0.015 (red). The solvents toluene (κTOL = 2.37) and acetonitrile (κACN = 35.67) involve the very similar frontier orbitals, which are not repeated here. κ is the dielectric constant of the solvent.
Fig. 11
Fig. 11. Dibenzalacetone derivatives experimental red-shift in TOL (open green squares) DCM (open red circles), and ACN (open blue triangles) with theoretical red-shift, using the TD-DFT methodology and M06-2X functional, and the 6-311+G(d,p) basis set with the implicit solvent method (IEFPCM) in TOL (solid green squares, κTOL = 2.37), DCM (solid red circles, κDCM = 8.93) and ACN (solid blue triangles, κACN = 35.67).

Similar articles

References

    1. Ostroverkhova O. Chem. Rev. 2016;116:13279–13412. - PubMed
    1. Kukhta N. A. Bryce M. R. Mater. Horiz. 2021;8:33–55. - PubMed
    1. Hirono A. Sakai H. Kochi S. Sato T. Hasobe T. J. Phys. Chem. B. 2020;124:9921–9930. - PubMed
    1. Mellado M. Sariego-Kluge R. Valdés-Navarro F. González C. Sánchez-González R. Pizarro N. Villena J. Jara-Gutierrez C. Cordova C. Bravo M. A. et al. . Spectrochim. Acta, Part A. 2023;291:122332. - PubMed
    1. Shafiq I. Khalid M. Muneer M. Asghar M. A. Baby R. Ahmed S. Ahamad T. de Alcântara Morais S. F. Braga A. A. Mater. Chem. Phys. 2023;308:128154.