Revealing Elasmobranch Distributions in Turbid Coastal Waters: Insights From Environmental DNA and Particle Tracking
- PMID: 39867497
- PMCID: PMC11758260
- DOI: 10.1002/ece3.70857
Revealing Elasmobranch Distributions in Turbid Coastal Waters: Insights From Environmental DNA and Particle Tracking
Abstract
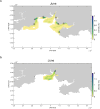
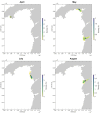
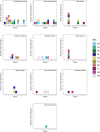
Many sharks, rays and skates are highly threatened and vulnerable to overexploitation, as such reliable monitoring of elasmobranchs is key to effective management and conservation. The mobile and elusive nature of these species makes monitoring challenging, particularly in temperate waters with low visibility. Environmental DNA (eDNA) methods present an opportunity to study these species in the absence of visual identification or invasive techniques. However, eDNA data alone can be difficult to interpret for species monitoring, particularly in a marine setting where its distribution can be influenced by water currents. In this study, we investigated the spatial and temporal distribution of elasmobranch species in two Special Areas for Conservation (SAC) off the coast of Wales. We took monthly eDNA samples for 1 year (starting September 2020 and March 2022 for the northern and southern SACs, respectively), and used metabarcoding to reveal the presence of elasmobranch species. We combined these data with hydrodynamic modelling and particle tracking methods to simulate the potential origins of the detected eDNA. We detected 11 elasmobranch species, including the critically endangered angelshark (Squatina squatina) and tope (Galeorhinus galeus). Most detections were in the spring and the fewest in the autumn. The particle tracking simulations predicted that eDNA was shed, on average, approximately 7 km and 15 km (in the northern and southern SACs, respectively) from the sampling stations at which it was detected. These results show that the two SACs represent important areas for elasmobranchs in the United Kingdom and demonstrate that eDNA methods combined with particle tracking simulations can represent a new frontier for monitoring marine species.
Mae llawer o siarcod a morgathod dan fygythiad difrifol ac yn agored i or‐ecsbloetio, felly mae gwaith dibynadwy i fonitro elasmobranciaid yn allweddol i reolaeth a chadwraeth effeithiol. Mae natur symudol a dirgel y rhywogaethau hyn yn ei gwneud hi'n anodd eu monitro, yn enwedig mewn dyfroedd tymherus â gwelededd isel. Mae dulliau DNA amgylcheddol (eDNA) yn rhoi cyfle i astudio'r rhywogaethau hyn yn absenoldeb y gallu i'w hadnabod yn weledol neu drwy ddefnyddio technegau ymyrrol. Fodd bynnag, gall data eDNA yn unig fod yn anodd ei ddehongli ar gyfer monitro rhywogaethau, yn enwedig mewn lleoliad morol lle gall cerrynt dŵr ddylanwadu ar ei ddosbarthiad. Yn yr. astudiaeth hon, fe wnaethom ymchwilio i ddosbarthiad gofodol ac amserol rhywogaethau elasmobranciaid mewn dwy Ardal Cadwraeth Arbennig (ACA) oddi ar arfordir Cymru. Fe wnaethom gymryd samplau eDNA misol dros gyfnod o flwyddyn (yn dechrau ym mis Medi 2020 a mis Mawrth 2022 ar gyfer yr. ACAau gogleddol a deheuol, yn y drefn honno), a defnyddio meta‐godau bar i ddatgelu pa rywogaethau elasmobranciaid a oedd yn bresennol. Cyfunwyd y data yma â modelu hydrodynamig a dulliau olrhain gronynnau i efelychu tarddiad posibl yr. eDNA a ganfuwyd. Canfuom 11 rhywogaeth o elasmobranciaid, gan gynnwys y maelgi (Squatina squatina) sydd Mewn Perygl Difrifol a'r ci glas (Galeorhinus galeus). Roedd y rhan fwyaf o'r darganfyddiadau yn y gwanwyn a'r lleiaf yn yr. hydref. Roedd yr. efelychiadau olrhain gronynnau yn rhagweld y byddai eDNA yn cael ei ollwng, ar gyfartaledd, tua 7 km a 15 km (yn yr. ACA gogleddol a deheuol, yn y drefn honno) o'r gorsafoedd samplu lle cafodd ei ganfod. Mae'r canlyniadau hyn yn dangos bod y ddwy ACA yn cynrychioli ardaloedd pwysig ar gyfer elasmobranchs yn y Deyrnas Unedig ac yn dangos y gall dulliau eDNA ynghyd ag efelychiadau olrhain gronynnau gynrychioli ffin newydd ar gyfer monitro rhywogaethau morol.
Keywords: eDNA; hydrodynamic modelling; marine; metabarcoding; sharks and rays.
© 2025 The Author(s). Ecology and Evolution published by John Wiley & Sons Ltd.
Conflict of interest statement
The authors declare no conflicts of interest.
Figures


Similar articles
-
Seeing through sedimented waters: environmental DNA reduces the phantom diversity of sharks and rays in turbid marine habitats.BMC Ecol Evol. 2021 Sep 6;21(1):166. doi: 10.1186/s12862-021-01895-6. BMC Ecol Evol. 2021. PMID: 34488638 Free PMC article.
-
A large scale temporal and spatial environmental DNA biodiversity survey of marine vertebrates in Brazil following the Fundão tailings dam failure.Mar Environ Res. 2023 Nov;192:106239. doi: 10.1016/j.marenvres.2023.106239. Epub 2023 Oct 28. Mar Environ Res. 2023. PMID: 37926039
-
Marine protected areas for demersal elasmobranchs in highly exploited Mediterranean ecosystems.Mar Environ Res. 2020 Sep;160:105033. doi: 10.1016/j.marenvres.2020.105033. Epub 2020 May 30. Mar Environ Res. 2020. PMID: 32907736
-
The vulnerability of sharks, skates, and rays to ocean deoxygenation: Physiological mechanisms, behavioral responses, and ecological impacts.J Fish Biol. 2024 Aug;105(2):482-511. doi: 10.1111/jfb.15830. Epub 2024 Jun 9. J Fish Biol. 2024. PMID: 38852616 Review.
-
A review of applications of environmental DNA for reptile conservation and management.Ecol Evol. 2022 Jun 5;12(6):e8995. doi: 10.1002/ece3.8995. eCollection 2022 Jul. Ecol Evol. 2022. PMID: 35784065 Free PMC article. Review.
References
-
- Andruszkiewicz Allan, E. , Zhang W. G., Lavery A., and Govindarajan A.. 2021. “Environmental DNA Shedding and Decay Rates From Diverse Animal Forms and Thermal Regimes.” Environmental DNA 3, no. 2: 492–514. 10.1002/edn3.141. - DOI
-
- Andruszkiewicz, E. A. , Koseff J. R., Fringer O. B., et al. 2019. “Modeling Environmental DNA Transport in the Coastal Ocean Using Lagrangian Particle Tracking.” Frontiers in Marine Science 6: 477. 10.3389/fmars.2019.00477. - DOI
-
- Brandão‐Dias, P. F. , Hallack D. M., Snyder E. D., et al. 2023. “Particle Size Influences Decay Rates of Environmental DNA in Aquatic Systems.” Molecular Ecology Resources 23, no. 4: 756–770. - PubMed
Associated data
LinkOut - more resources
Full Text Sources

