. 2024 Dec 23:43:100935.
doi: 10.1016/j.bbih.2024.100935. eCollection 2025 Feb.

Inhibition of hippocampal interleukin-6 receptor-evoked signalling normalises long-term potentiation in dystrophin-deficient mdx mice

Affiliations

Inhibition of hippocampal interleukin-6 receptor-evoked signalling normalises long-term potentiation in dystrophin-deficient mdx mice

Kimberley A Stephenson et al. Brain Behav Immun Health. .

Abstract

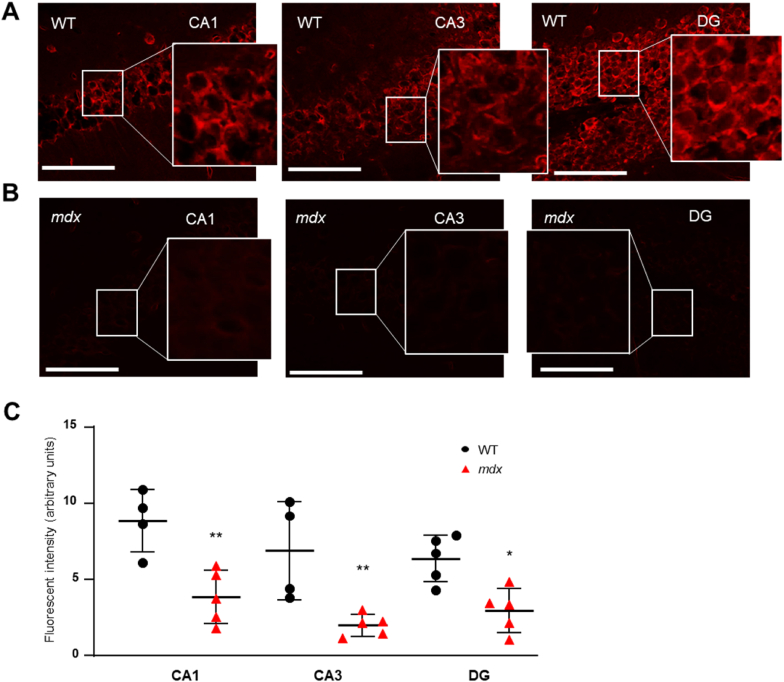
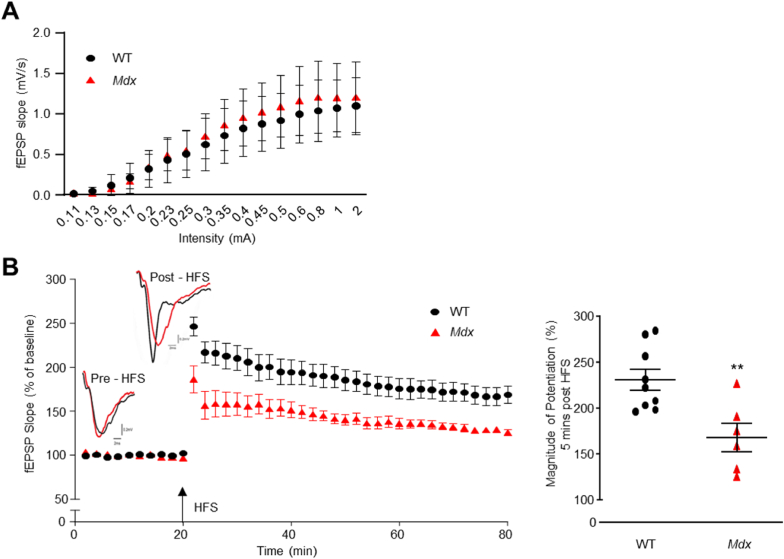
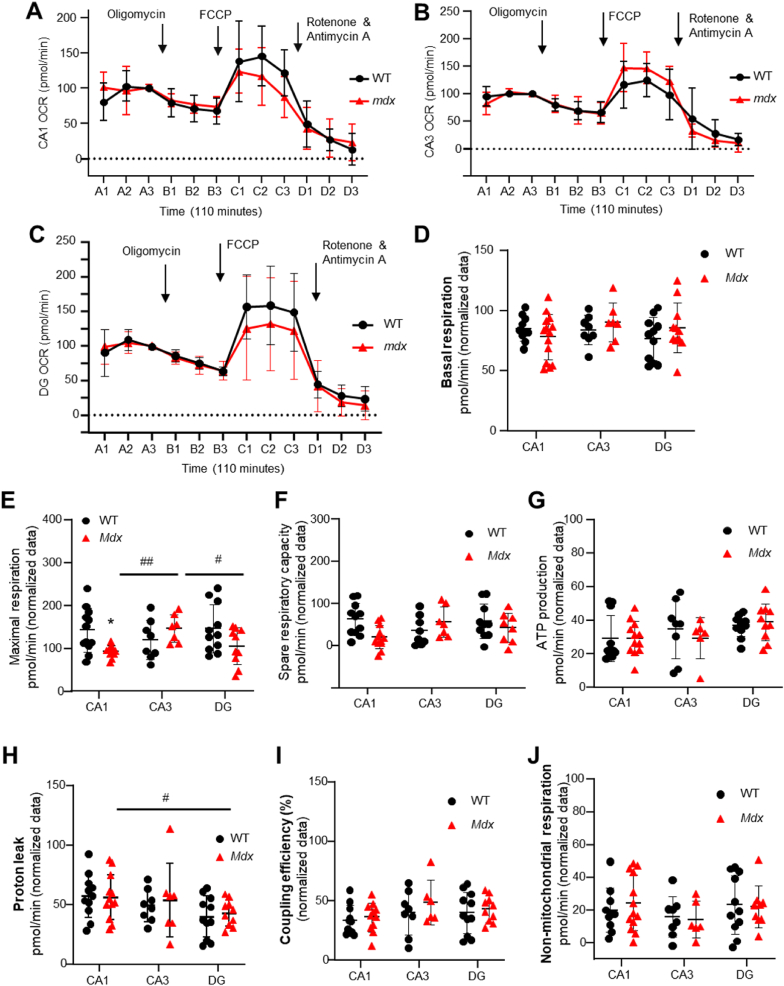
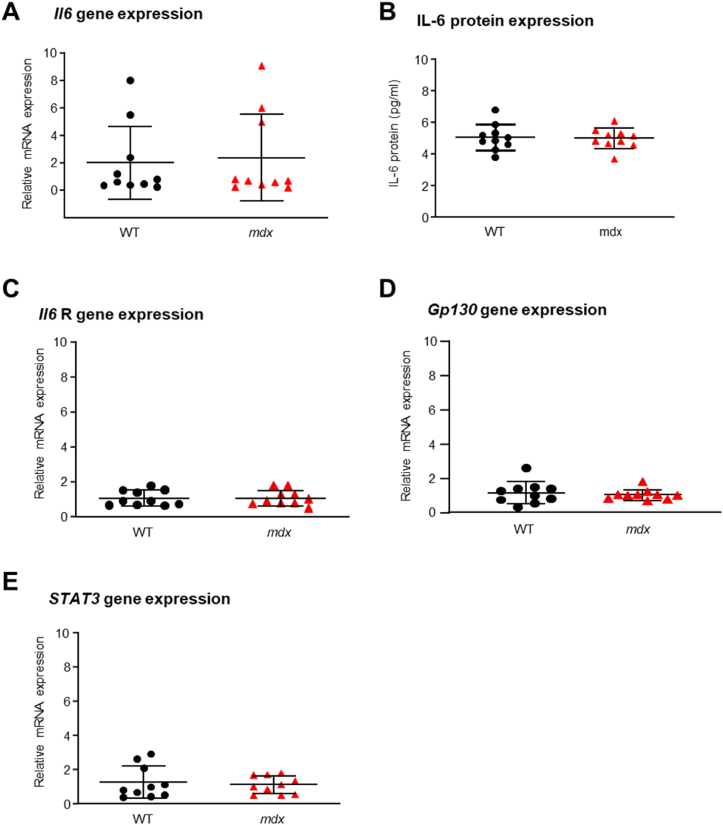
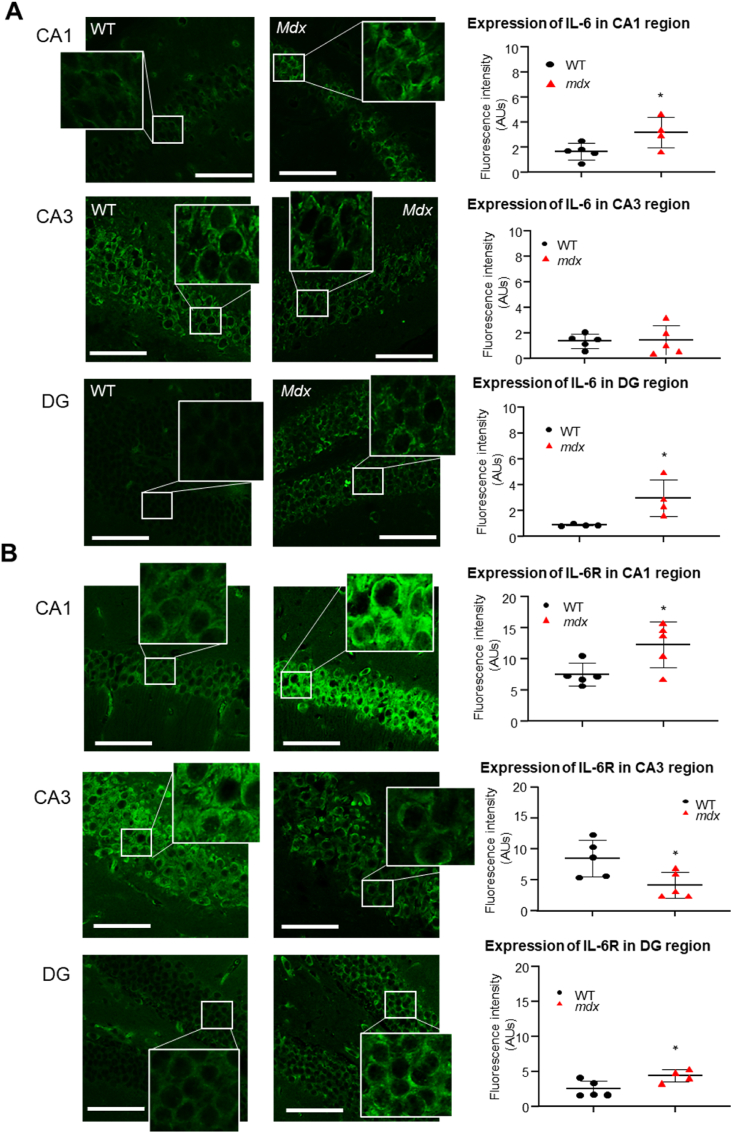
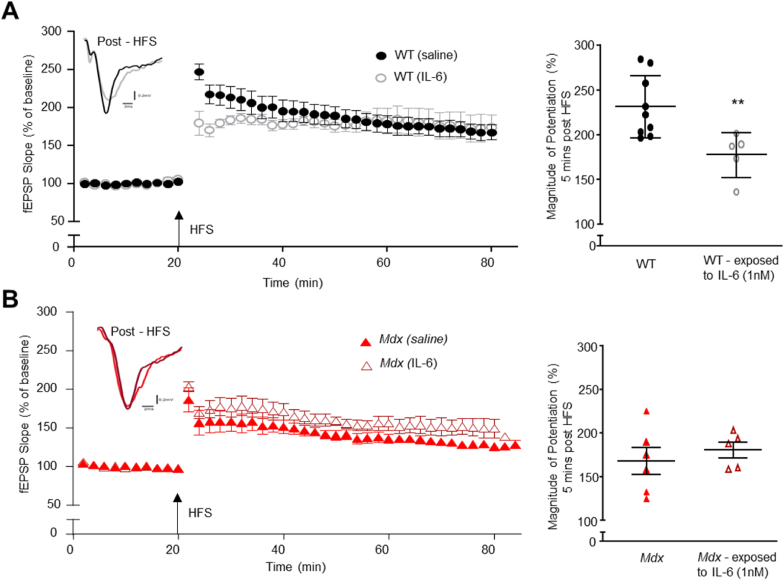
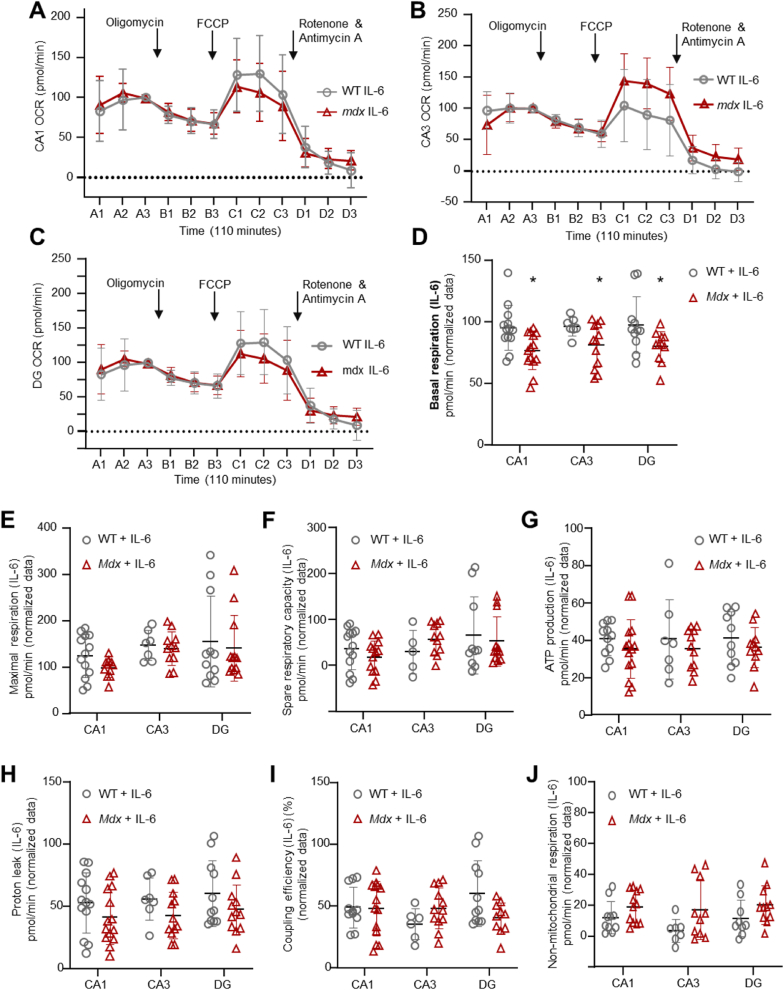
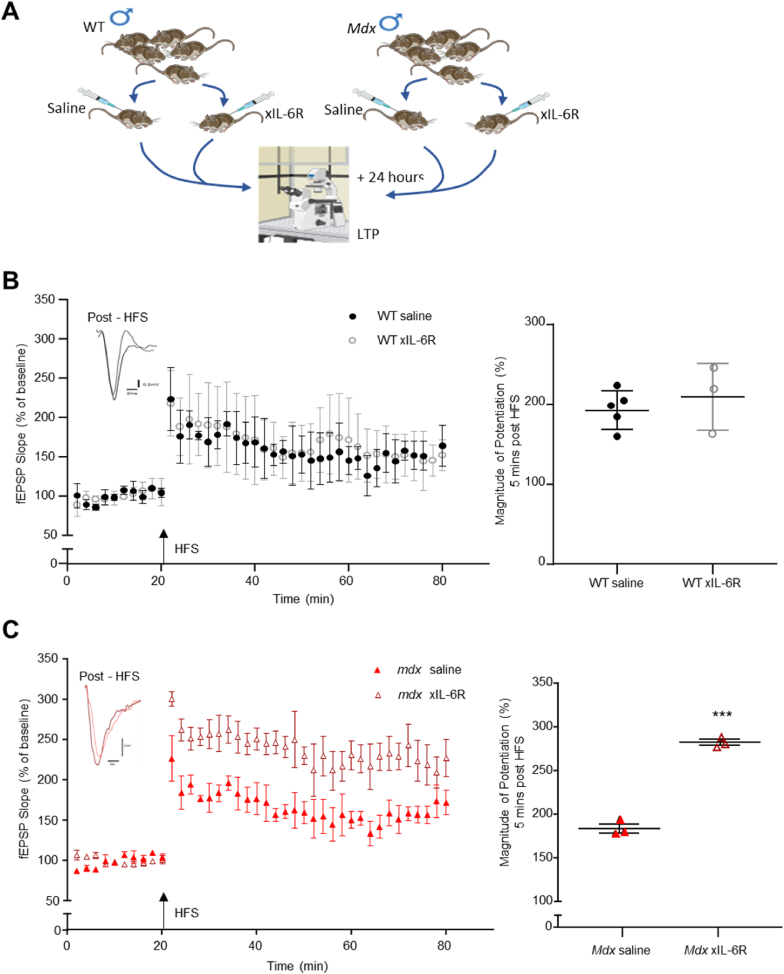
Duchenne muscular dystrophy (DMD), an X-linked neuromuscular disorder, characterised by progressive immobility, chronic inflammation and premature death, is caused by the loss of the mechano-transducing signalling molecule, dystrophin. In non-contracting cells, such as neurons, dystrophin is likely to have a functional role in synaptic plasticity, anchoring post-synaptic receptors. Dystrophin-expressing hippocampal neurons are key to cognitive functions such as emotions, learning and the consolidation of memories. In the context of disease-induced chronic inflammation, we have explored the role of the pleiotropic cytokine, interleukin (IL)-6 in hippocampal dysfunction using immunofluorescence, electrophysiology and metabolic measurements in dystrophic mdx mice. Hippocampal long-term potentiation (LTP) of the Schaffer collateral-CA1 projections was suppressed in mdx slices. Given the importance of mitochondria-generated ATP in synaptic plasticity, reduced maximal respiration in the CA1 region may impact upon this process. Consistent with a role for IL-6 in this observation, early LTP was suppressed in dystrophin-expressing wildtype slices exposed to IL-6. In dystrophic mdx mice, exposure to IL-6 suppressed mitochondrial-mediated basal metabolism in CA1, CA3 and DG hippocampal regions. Furthermore, blocking IL-6-mediated signalling by administering neutralising monoclonal IL-6 receptor antibodies intrathecally, normalised LTP in mdx mice. The impact of dystrophin loss from the hippocampus was associated with modified cellular bioenergetics, which underpin energy-driven processes such as the induction of LTP. The additional challenge of pathophysiological levels of IL-6 resulted in altered cellular bioenergetics, which may be key to cognitive deficits associated with the loss of dystrophin.

Keywords: Bioenergetics; Duchenne muscular dystrophy; Dystrophin; Hippocampus; Interleukin-6; Long-term potentiation.


Conflict of interest statement

The authors declare the following financial interests/personal relationships which may be considered as potential competing interests: Dervla O'Malley reports financial support was provided by 10.13039/501100001590Health Research Board Ireland. Dervla O'Malley reports equipment, drugs, or supplies was provided by Chugai Pharmaceutical Co., Ltd, Tokyo, Japan. If there are other authors, they declare that they have no known competing financial interests or personal relationships that could have appeared to influence the work reported in this paper.

Figures

Fig. 1
Fig. 1
Dystrophin is absent from CA1, CA3 and dentate gyrus (DG) regions of mdx hippocampal tissue. Representative immunofluorescent images from A: wildtype (WT) and B: dystrophic mdx mice and C: semi-quantitative data plot (WT: black circles; mdx: red triangles) illustrate the intensity (corrected total cell fluorescence, CTCF) of dystrophin expression in the neuronal cell layers from CA1, CA3 and DG regions of hippocampal slices. Insets illustrate pattern of dystrophin staining in neurons in the cell body layers. ∗∗ and ∗∗ indicates p < 0.05 and p < 0.01, respectively. Scalebar: 30 μm. (For interpretation of the references to colour in this figure legend, the reader is referred to the Web version of this article.)
Fig. 2
Fig. 2
Hippocampal long-term potentiation (LTP) is suppressed in mdx mice. A: The hippocampal input/output (I/O) curve for wildtype (WT, black circles) and mdx (red triangles) mice prior to LTP induction were similar. B: The graph and representative sweeps (inset) show extracellular field excitatory post-synaptic potentials (fEPSPs) from CA1 stratum radiatum before and after tetanic high frequency stimulation (HFS) to induce LTP in WT and mdx mice. Pooled data of the amplitude of potentiation 5 min after HFS is shown for WT and mdx hippocampal slices. ∗∗ indicates p < 0.01. (For interpretation of the references to colour in this figure legend, the reader is referred to the Web version of this article.)
Fig. 3
Fig. 3
Regional differences in bioenergetics were evident in WT and mdx hippocampal tissue. The graphs illustrate real-time oxygen consumption rates (OCRs) over a period of 110 min in control wildtype (WT, black circles) and mdx (red triangles) hippocampal tissue punches from A: CA1; B: CA3 and C: DG regions. Time-response relationships for OCRs before and after addition of oligomycin, FCCP, and rotenone and antimycin A are illustrated with arrows for all groups. The data plots illustrate regional differences in D: basal respiration, E: maximal respiration, F: spare respiratory capacity, G: ATP production, H: proton leak, I: coupling efficiency and J: non-mitochondrial respiration in the CA1, CA3 and DG hippocampal regions from WT and mdx mice. ∗ indicates p < 0.05 between strains. # and ## indicate p < 0.05 and p < 0.01 differences between brain regions. (For interpretation of the references to colour in this figure legend, the reader is referred to the Web version of this article.)
Fig. 4
Fig. 4
Total interleukin-6 (IL-6) levels are similar in whole, homogenised wildtype (WT) and mdx hippocampal tissue. A: Data plots indicate that the relative mRNA expression of Il6 and B: protein expression of IL-6 was not different between hippocampal homogenates from wildtype (WT) and dystrophic mdx mice. C: Pooled data of relative mRNA expression of Il6 receptors (Il6 R) and D: the transmembrane glycoprotein, gp130, a signal transducing molecule for IL-6, are similar in WT and mdx hippocampal tissue. E: No difference was detected between groups in the relative gene expression for STAT3. P > 0.05 for all data sets.
Fig. 5
Fig. 5
Regionally distinct expression of hippocampal interleukin-6 (IL-6) and IL-6 receptors differs between WT and mdx mice. Representative immunofluorescent images and data plots of corrected total cell fluorescence illustrate expression of A: IL-6 and B: IL-6 receptors in the neuronal cell layers of CA1, CA3 and DG hippocampal regions from wildtype (WT, black circles) and dystrophin-deficient, mdx (red triangles) mice. Insets show digitally magnified images of immuolabelled cell bodies. Scalebar: 70μm. ∗ indicates p < 0.05. (For interpretation of the references to colour in this figure legend, the reader is referred to the Web version of this article.)
Fig. 6
Fig. 6
Long-term potentiation (LTP) is suppressed in WT hippocampal slices exposed to interleukin (IL)-6. The graphs and representative sweeps (inset) show fEPSPs before and after induction of LTP in A: WT mice or B:mdx mice under control (saline, solid shapes) conditions or following bath incubation with interleukin-6 (IL-6, 1 nM, >2 h, open shapes). Pooled data of the amplitude of potentiation 5 min after HFS is shown for WT and mdx hippocampal slices exposed to saline or IL-6. ∗∗ indicates p < 0.01.
Fig. 7
Fig. 7
Interleukin (IL) −6 suppressed basal mitochondrial respiration in mdx CA1, CA3 and DG hippocampal regions. A: The graphs illustrate real-time oxygen consumption rates (OCRs) over a period of 110 min in wildtype (WT) and mdx hippocampal tissue punches from CA1; B: CA3 and C: DG cell body layers, which had been exposed to IL-6 (1 nM, 1 h). Time-response relationships for OCRs before and after addition of oligomycin, FCCP, and rotenone A and antimycin A are illustrated with arrows for all groups. The data plots illustrate regional differences in D: basal respiration, E: maximal respiration, F: spare respiratory capacity, G: ATP production, H: proton leak, I: coupling efficiency and J: non-mitochondrial respiration in the CA1, CA3 and DG hippocampal regions from IL-6- exposed tissue from WT and mdx mice. ∗ indicates p < 0.05.
Fig. 8
Fig. 8
Hippocampal long-term potentiation is normalised in mdx mice treated with neutralising monoclonal xIL-6R antibodies (xIL-6R). A: The illustration outlines the protocol used for the intervention study. B: The graph and representative sweeps (inset) show extracellular field excitatory post-synaptic potentials (fEPSPs) from CA1 stratum radiatum in wildtype (WT) mice intrathecally injected with saline (black circles) and WT mice intrathecally administered xIL-6R (open grey circles) before and after tetanic high frequency stimulation (HFS, indicated by arrow) to induce LTP. C: The graph and representative sweeps (inset) show extracellular fEPSPs in mdx mice intrathecally injected with saline (solid red triangles) or xIL-6R (open red triangles) before and after tetanic HFS (indicated by arrow) to induce LTP. Pooled data of the amplitude of potentiation 5 min after HFS is shown for WT and mdx hippocampal slices following in vivo treatment with saline or xIL-6R monoclonal antibodies. ∗∗∗ indicates p < 0.001. (For interpretation of the references to colour in this figure legend, the reader is referred to the Web version of this article.)

Similar articles

Cited by

References

    1. Anderson J.L., Head S.I., Rae C., Morley J.W. Brain function in Duchenne muscular dystrophy. Brain. 2002;125:4–13. - PubMed
    1. Bagdatlioglu E., Porcari P., Greally E., Blamire A.M., Straub V.W. Cognitive impairment appears progressive in the mdx mouse. Neuromuscul. Disord. 2020;30:368–388. - PMC - PubMed
    1. Banks W.A., Kastin A.J., Gutierrez E.G. Penetration of interleukin-6 across the murine blood-brain barrier. Neurosci. Lett. 1994;179:53–56. - PubMed
    1. Bliss T., Collingridge G.L. Persistent memories of long-term potentiation and the N-methyl-d-aspartate receptor. Brain Neurosci Adv. 2019;3 - PMC - PubMed
    1. Bliss T.V., Collingridge G.L. A synaptic model of memory: long-term potentiation in the hippocampus. Nature. 1993;361:31–39. - PubMed

LinkOut - more resources