. 2025 Jan 21:19:405-424.
doi: 10.2147/DDDT.S489323. eCollection 2025.

Active Ingredients and Potential Mechanism of Additive Sishen Decoction in Treating Rheumatoid Arthritis with Network Pharmacology and Molecular Dynamics Simulation and Experimental Verification

Affiliations

Active Ingredients and Potential Mechanism of Additive Sishen Decoction in Treating Rheumatoid Arthritis with Network Pharmacology and Molecular Dynamics Simulation and Experimental Verification

Jinhong Ren et al. Drug Des Devel Ther. .

Abstract

Background: Rheumatoid arthritis (RA) is a chronic inflammatory autoimmune disease in which macrophages produce cytokines that enhance inflammation and contribute to the destruction of cartilage and bone. Additive Sishen decoction (ASSD) is a widely used traditional Chinese medicine for the treatment of RA; however, its active ingredients and the mechanism of its therapeutic effects remain unclear.

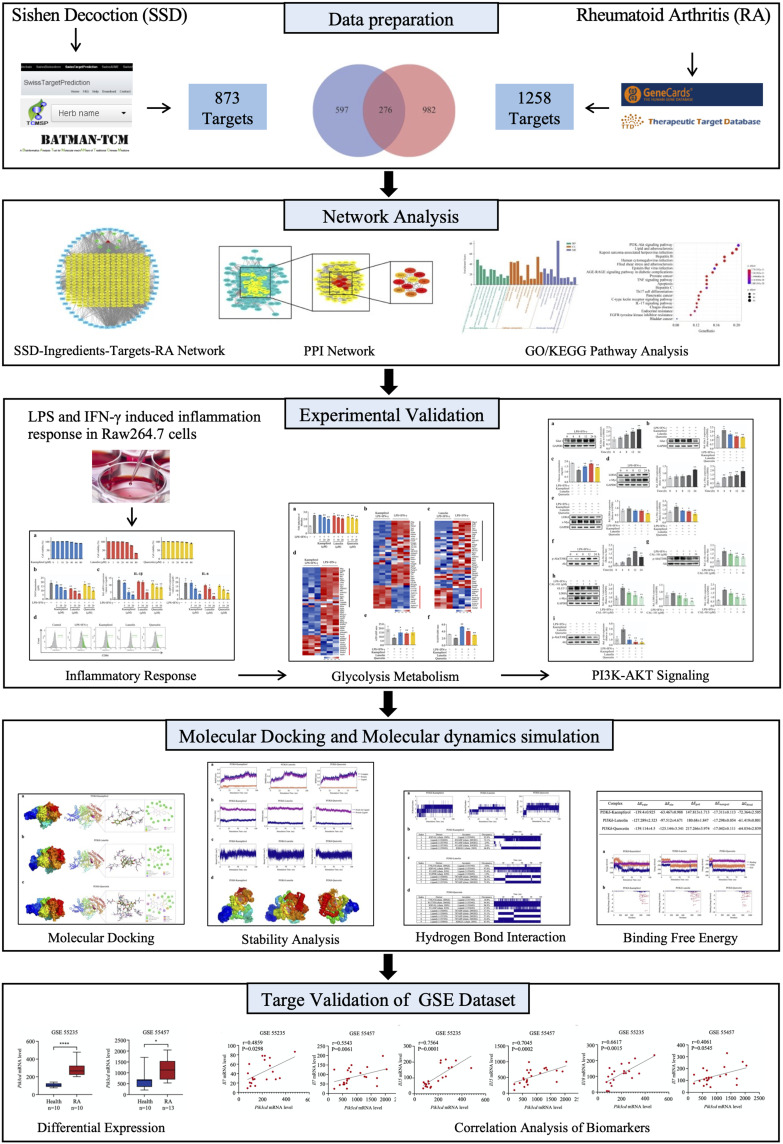
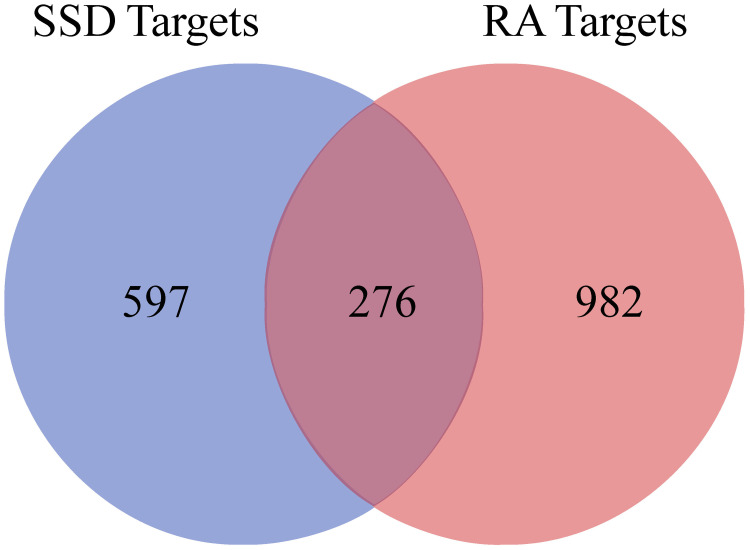
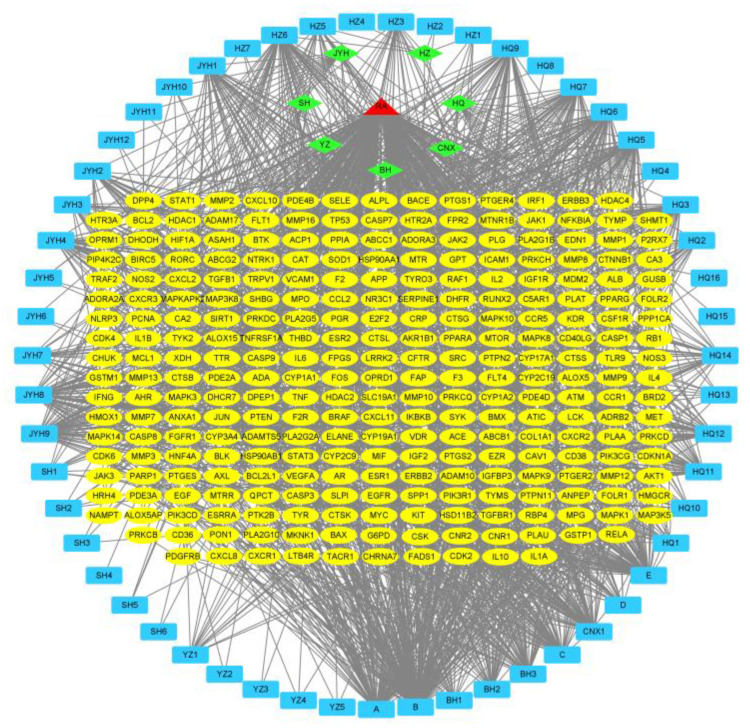
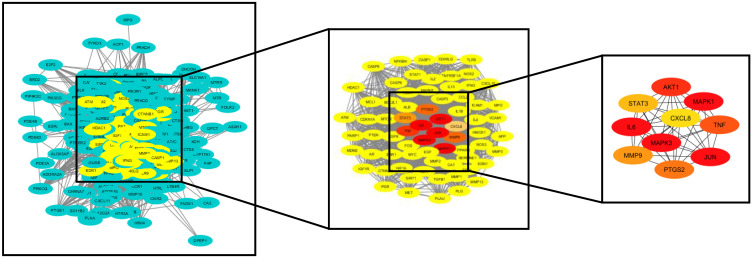
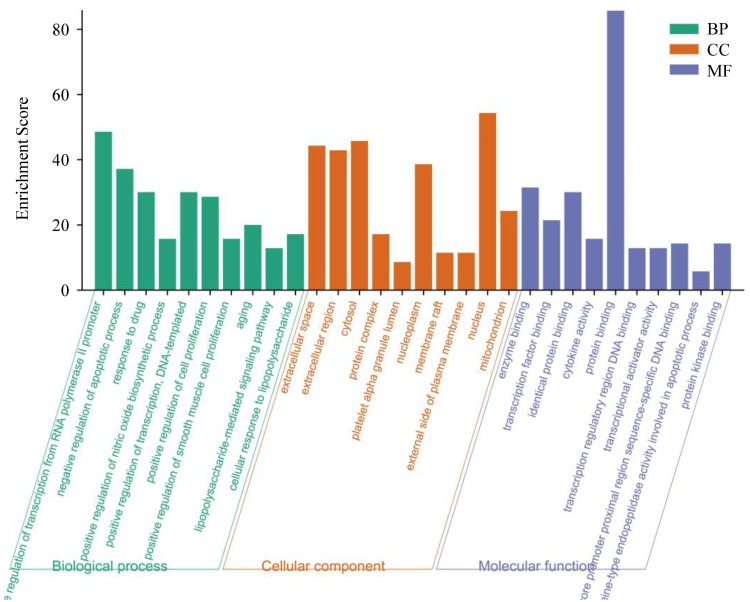
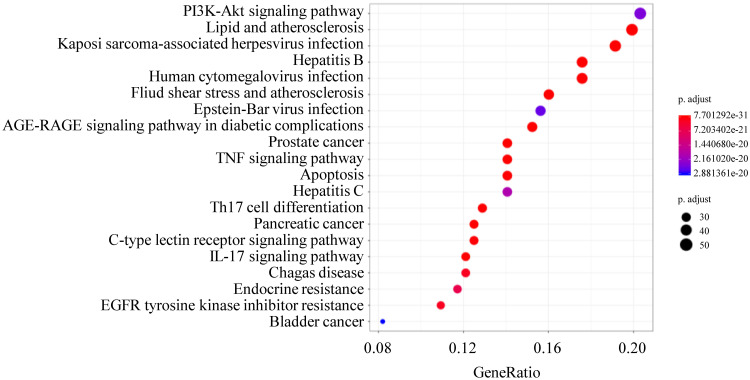
Methods: To predict the ingredients and key targets of ASSD, we constructed "drug-ingredient-target-disease" and protein-protein interaction networks. Gene ontology and Kyoto Encyclopedia of Genes and Genomes enrichment analyses were performed to explore the potential mechanism. The activity of the predicted key ingredients was verified in lipopolysaccharide-stimulated macrophages. The binding mode between the key ingredients and key targets was elucidated using molecular docking and molecular dynamics simulation.

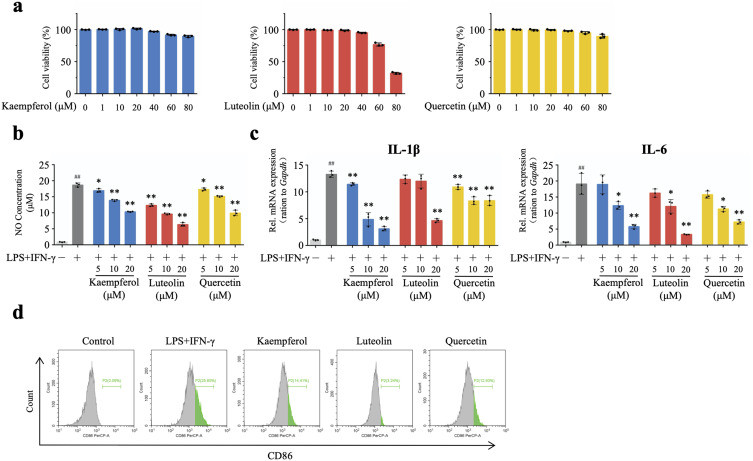
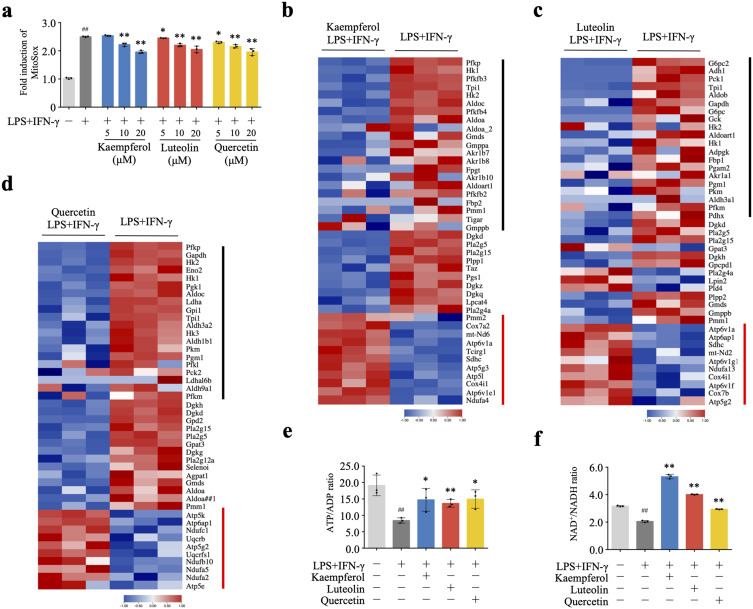
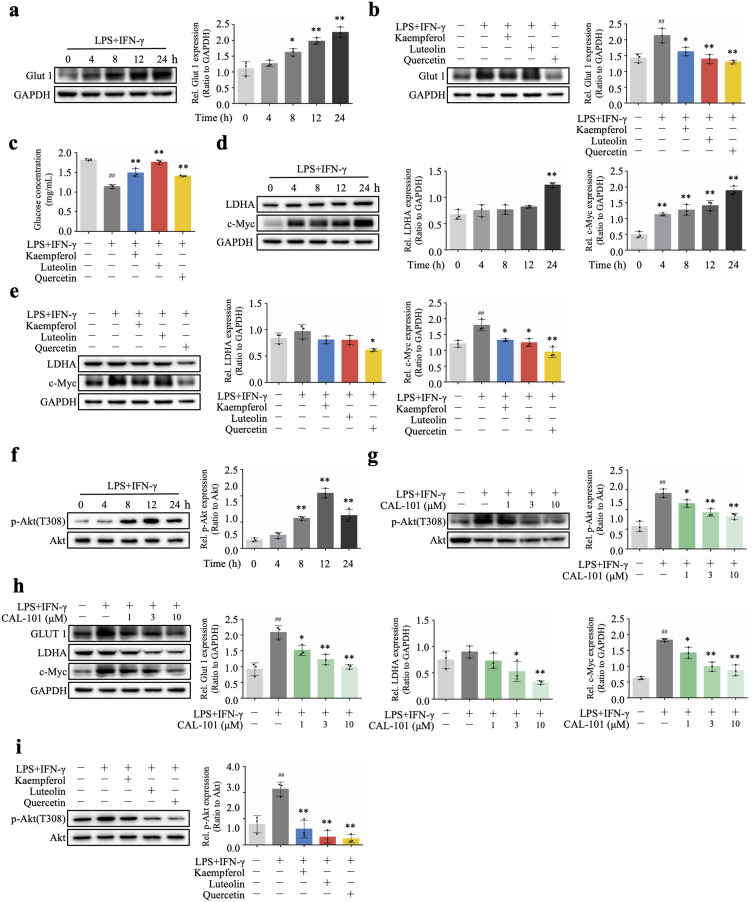
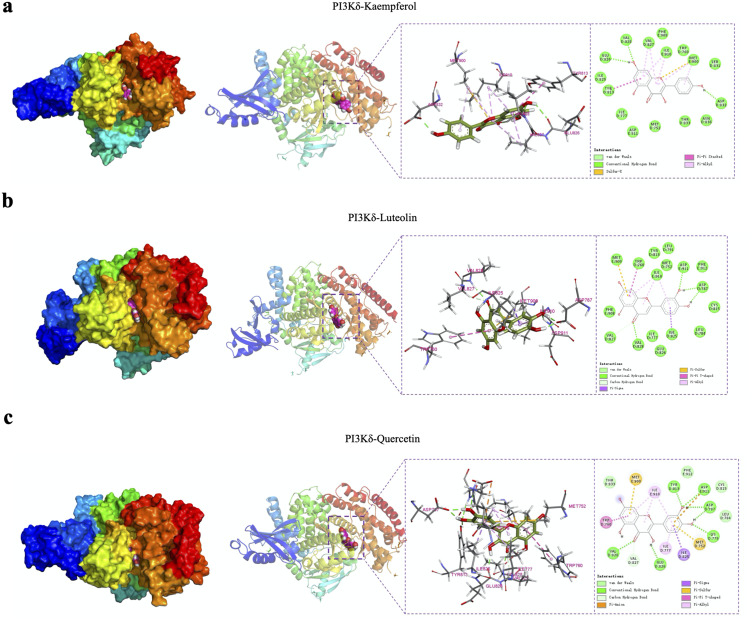
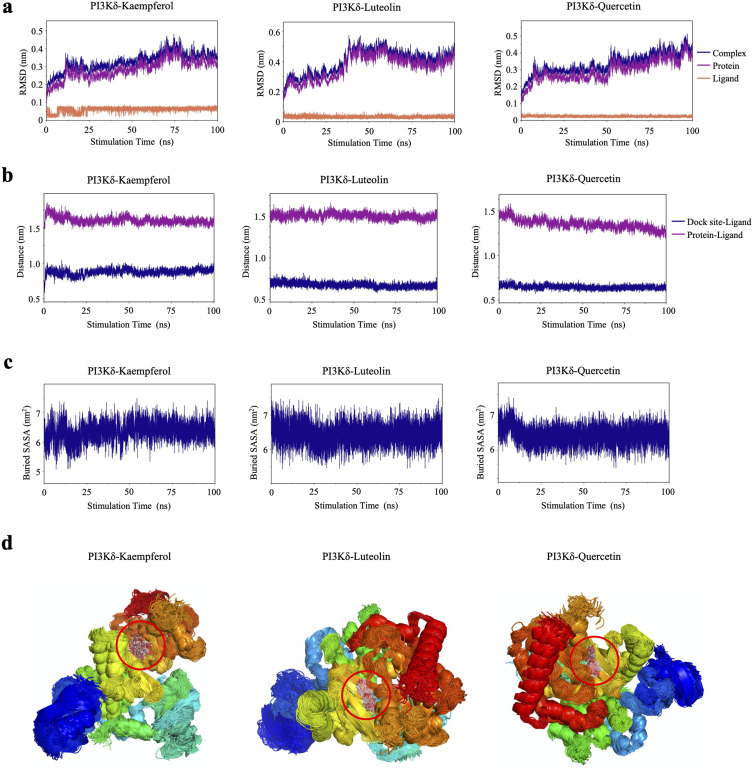
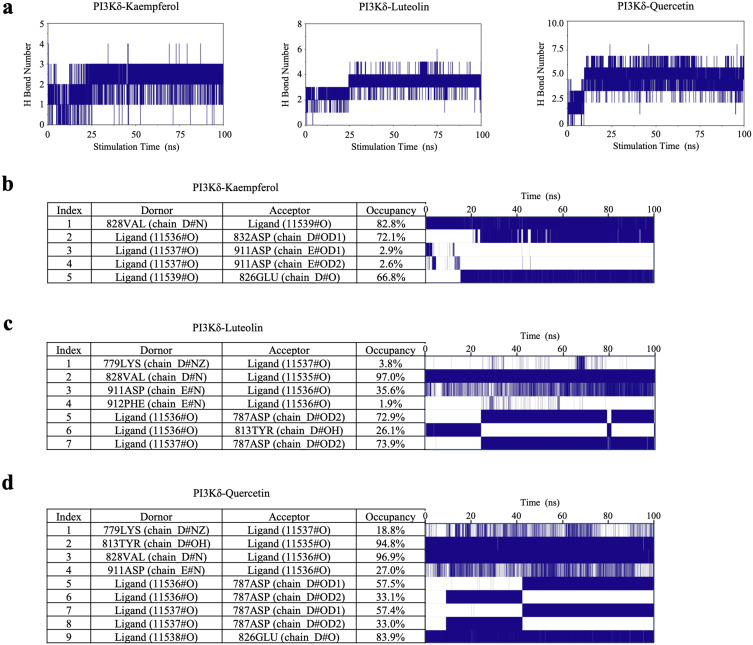
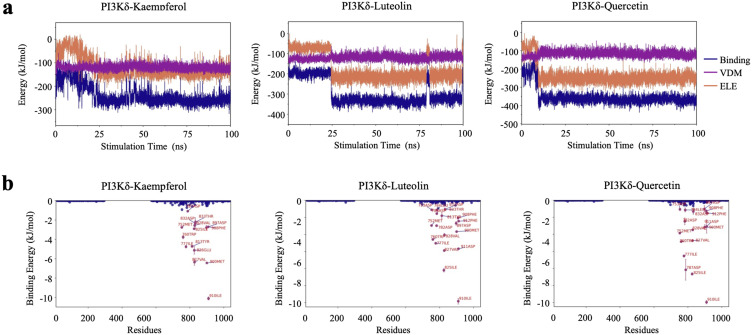
Results: In all, 75 ASSD active ingredients and 1258 RA targets were analyzed, of which kaempferol, luteolin, and quercetin were considered key components that mainly act through inflammation-related pathways, such as the PI3K-AKT, TNF, and IL-17 signaling pathways, to ameliorate RA. Transcriptome sequencing suggested that kaempferol-, luteolin-, and quercetin-mediated inhibition of glycolysis reduced the lipopolysaccharide-induced production of proinflammatory factors. In vitro experiments indicated that kaempferol, luteolin, and quercetin decreased Glut1 and LDHA expression by diminishing PI3K-AKT signaling to inhibit glycolysis. Molecular dynamic simulation revealed that kaempferol, luteolin, and quercetin stably occupied the hydrophobic pocket of PI3Kδ.

Conclusion: Our results show that the PI3Kδ-mediated anti-inflammatory responses elicited by kaempferol, luteolin, and quercetin are crucial for the therapeutic efficacy of ASSD against RA.

Keywords: Autoimmune disease; PI3K-AKT; glycolysis; inflammation; traditional Chinese medicine.


Conflict of interest statement

The authors have declared no conflicts of interest in this work.

Figures

Figure 1
Figure 1
Flow chart of the present study.
Figure 2
Figure 2
Venn diagram of 873 additive Sishen decoction (ASSD) and 1258 rheumatoid arthritis (RA) targets showing an overlap of 276 targets.
Figure 3
Figure 3
The ASSD-ingredients-targets-RA network. The green rhombuses represent 7 traditional herbs in additive Sishen decoction (ASSD), blue rectangles represent the active ingredients in 7 traditional herbs, and yellow ellipses represent 276 potential targets in ASSD-treated rheumatoid arthritis (RA).
Figure 4
Figure 4
Protein–protein interaction (PPI) network of the 276 potential targets. The nodes represent proteins, and edges represent protein–protein interactions.
Figure 5
Figure 5
Gene ontology (GO) enrichment with the top-10 P-values for each item.
Figure 6
Figure 6
Kyoto encyclopedia of genes and genomes (KEGG) enrichment with the top-20 P-values.
Figure 7
Figure 7
Inhibition of lipopolysaccharide (LPS)+interferon gamma (IFN-γ)-induced inflammatory responses in RAW 264.7 cells by kaempferol, luteolin, and quercetin. (a) Cytotoxicity of kaempferol, luteolin, and quercetin in RAW 264.7 cells after 24 h of treatment. (b) Nitric oxide (NO) levels in the culture medium were measured using the Griess reagent. (c) Quantitative RT-PCR analysis of the mRNA levels of Il1b and Il6 in RAW 264.7 cells stimulated with LPS+IFN-γ in the presence of the indicated doses of kaempferol, luteolin, or quercetin for 24 h. (d) Flow cytometry analysis of Cd86 expression in RAW 264.7 cells stimulated with LPS+IFN-γ in the presence of kaempferol, luteolin, or quercetin (20 μmol/L) for 24 h. Three samples were analyzed for each group. The data were analyzed using an unpaired t-test. ## P<0.01 compared with the control group, * P<0.05 and ** P<0.01 compared with the LPS+IFN-γ group. Bar graphs show mean ± SD.
Figure 8
Figure 8
Inhibition of glycolysis involves kaempferol, luteolin, and quercetin-mediated anti-inflammatory responses. (a) MitoSox staining, indicative of mitochondrial ROS levels, of RAW 264.7 cells stimulated with lipopolysaccharide (LPS)+ interferon gamma (IFN-γ) in the presence of the indicated doses of kaempferol, luteolin, or quercetin for 24 h. (b-d) Heat map of statistically differentially expressed genes by RNA sequencing transcriptome analysis in RAW 264.7 cells stimulated with LPS+IFN-γ in the presence of kaempferol, luteolin, or quercetin (20 μmol/L) for 24 h. Black Bar points to the genes downregulated in glycolysis and red bar points to the genes upregulated in oxidative phosphorylation. (e) The ATP/ADP ratio in cell lysates was determined using an ATP/ADP assay kit. (f) The NAD+/NADH ratio in cell lysates was determined using an NAD+/NADH assay kit. Three samples were analyzed for each group. The data were analyzed using an unpaired t-test. ## P<0.01 compared with the control group, * P<0.05 and ** P<0.01 compared with the LPS+INF-γ group. Bar graphs show mean ± SD.
Figure 9
Figure 9
Kaempferol, luteolin, and quercetin suppressed glycolysis through the PI3K-AKT signaling. (a-d) RAW 264.7 cells were stimulated with lipopolysaccharide (LPS)+ interferon gamma (IFN-γ) for the indicated time points. Immunoblotting and normalized expression of Glut, Ldha, and c-Myc against GAPDH. (b-e) RAW 264.7 cells were stimulated with LPS+IFN-γ in the presence of kaempferol, luteolin, or quercetin (20 μmol/L) for 24 h. Immunoblotting and normalized expression of Glut, Ldha, and c-Myc against GAPDH. (c) Glucose levels in the culture medium were measured with a glucose assay kit. (f) RAW 264.7 cells were stimulated with LPS+IFN-γ for the indicated time points. Immunoblotting and normalized expression of p-Akt (T308) against Akt. (g and h) RAW 264.7 cells were stimulated with LPS+IFN-γ in the presence of the PI3K inhibitor CAL-101 (1, 3, or 10 μmol/L) for 24 h. The immunoblot shows normalized expression of p-Akt (T308) against Akt as well as of Glut, Ldha, and c-Myc against GAPDH. (i) RAW 264.7 cells were stimulated with LPS+IFN-γ in the presence of kaempferol, luteolin, or quercetin (20 μmol/L) for 24 h. Immunoblotting and normalized expression of p-Akt (T308) against Akt. Three samples were analyzed for each group. The data were analyzed using an unpaired t-test. ## P<0.01 compared with the control group, * P<0.05 and ** P<0.01 compared with the LPS+IFN-γ group. Bar graphs show mean ± SD.
Figure 10
Figure 10
Molecular docking of PI3kδ and the compounds. (a) Binding mode of PI3kδ and kaempferol. (b) Binding mode of PI3kδ and luteolin. (c) Binding mode of PI3kδ and quercetin.
Figure 11
Figure 11
Stability analysis of PI3kδ and compounds in molecular dynamic simulations. (a) RMSD of the protein, ligand, and protein-ligand complex. (b) Centroid evolution analysis of PI3kδ and compounds. (c) Buried SASA analysis of PI3kδ and compounds. (d) The simulated conformational congruence of PI3kδ and the compounds.
Figure 12
Figure 12
Analysis of hydrogen bond interaction of PI3kδ and compounds in molecular dynamic simulations. (a) Hydrogen bond map of PI3kδ and compounds. (b) The occupancy of hydrogen bonds for PI3kδ and kaempferol. (c) The occupancy of hydrogen bonds for PI3kδ and luteolin. (d) The occupancy of hydrogen bonds for PI3kδ and quercetin.
Figure 13
Figure 13
Analysis of the interaction and key amino acid residues of PI3kδ and the compounds in molecular dynamic simulations. (a) van der Waals force (VDW) and electrostatic (ELE) interaction analysis of PI3kδ and compounds. (b) The key amino acid residues between PI3kδ and compounds.
Figure 14
Figure 14
PI3kδ was elevated in the synovial tissue of patients with RA. (a) The mRNA levels of Pik3cd (gene name of PI3kδ) in synovial specimens of RA in the GSE55235 and GSE55457 datasets. Unpaired t-test. * P<0.05 and **** P<0.0001 compared with the healthy group. (b-d) Pearson’s correlation of Pik3cd with the mRNA levels of Il7, Il15, and Il18 in RA in the GSE55235 and GSE55457 datasets. Two-tailed Pearson χ2 test.

Similar articles

Cited by

References

    1. Sparks JA. Rheumatoid Arthritis. Ann Intern Med. 2019;170:Itc1–itc16. doi:10.7326/AITC201901010 - DOI - PubMed
    1. Aletaha D, Smolen JS. Diagnosis and Management of Rheumatoid Arthritis: a Review. JAMA. 2018;320:1360–1372. doi:10.1001/jama.2018.13103 - DOI - PubMed
    1. Weyand CM, Goronzy JJ. The immunology of rheumatoid arthritis. Nat Immunol. 2021;22:10–18. doi:10.1038/s41590-020-00816-x - DOI - PMC - PubMed
    1. Janossy G, Panayi G, Duke O, et al. Rheumatoid arthritis: a disease of T-lymphocyte/macrophage immunoregulation. Lancet. 1981;2:839–842. - PubMed
    1. Udalova IA, Mantovani A, Feldmann M. Macrophage heterogeneity in the context of rheumatoid arthritis, Nature reviews. Rheumatology. 2016;12:472–485. doi:10.1038/nrrheum.2016.91 - DOI - PubMed

MeSH terms

LinkOut - more resources