Development and validation of a glycolysis-associated gene signature for predicting the prognosis, immune landscape, and drug sensitivity in bladder cancer
- PMID: 39867879
- PMCID: PMC11757262
- DOI: 10.3389/fimmu.2024.1430583
Development and validation of a glycolysis-associated gene signature for predicting the prognosis, immune landscape, and drug sensitivity in bladder cancer
Abstract
Background: Bladder cancer (BCa) is one of the most common malignancies worldwide, and its prognostication and treatment remains challenging. The fast growth of various cancer cells requires reprogramming of its energy metabolism using aerobic glycolysis as a major energy source. However, the prognostic and therapeutic value of glycolysis-related genes in BCa remains to be determined.
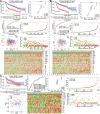
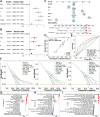
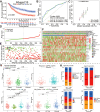
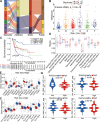
Methods: The fused merge dateset from TCGA, GSE13507 and GSE31684 were used for the analysis of glycolysis-related genes expression or subtyping; and corresponding clinical data of these BCa patients were also collected. In the merge cohort, we constructed a 18 multigene signature using the least absolute shrinkage and selection operator (LASSO) Cox regression model. The four external cohorts (i.e., IMvigor210, GSE32894, GSE48276 and GSE48075) of BCa patients were used to validate the accuracy. We evaluated immune infiltration using seven published algorithms: CIBERSORT, QUANTISEQ, XCELL, TIMER, CIBERSORT-ABS, EPIC, and MCPCOUNTER. Subsequently, in order to analyze the correlation between risk groups(scores) and overall survival, recognised immunoregolatory cells or common chemotherapeutic agents, clinicopathological data and immune checkpoint-related genes of BCa patients, Wilcox rank test, chi-square test, cox regression and spearman's correlation were performed.
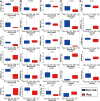
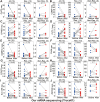
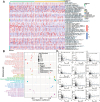
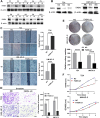
Results: Conspicuously, we could see that CD8+ T, cancer associated fibroblast, macrophage M2, NK, endothelial cells and so on were significantly dysregulated between the two risk groups. In addition, compared with the low-risk group, high-risk group predicted poor prognosis and relatively weak sensitivity of chemotherapy. Additionally, we also found that the expression level of partial genes in the model was significantly correlated with objective responses to anti-PD-1 or anti-PD-L1 treatment in the IMvigor210, GSE111636, GSE176307, GSE78220 or GSE67501 cohort; and its expression level was also varied in different objective response cases receiving tislelizumab combined with low-dose nab-paclitaxel therapy based on our mRNA sequencing (TRUCE-01). According to "GSEA" algorithm of R package "clusterProfiler", the most significantly enriched HALLMARK, KEGG pathway and GO term was separately the 'Epithelial Mesenchymal Transition', 'Ecm Receptor Interaction' and 'MF_Extracellular_matrix_structural_constitunet' in the high- vs. low-risk group. Subsequently, we verified the protein and mRNA expression of interested model-related genes from the Human Protein Atlas (HPA) and 10 paired BCa tissues collected by us. Furthermore, in vitro functional experiments demonstrated that FASN was a functional oncogene in BCa cells through promoting cell proliferation, migration, and invasion abilities.
Conclusion: In summary, the glycolysis-associated gene signature established by us exhibited a high predictive performance for the prognosis, immunotherapeutic responsiveness, and chemotherapeutic sensitivity of BCa. And, The model also might function as a chemotherapy and immune checkpoint inhibitor (ICI) treatment guidance.
Keywords: bladder cancer; gene signature; glycolysis; immune status; prognosis.
Copyright © 2025 Shen, Suo, Guo, Su, Zhang, Yang, Wu, Fan, Zhou and Hu.
Conflict of interest statement
The authors declare that the research was conducted in the absence of any commercial or financial relationships that could be construed as a potential conflict of interest.
Figures




Similar articles
-
Identification of a dysregulated CircRNA-associated gene signature for predicting prognosis, immune landscape, and drug candidates in bladder cancer.Front Oncol. 2022 Oct 10;12:1018285. doi: 10.3389/fonc.2022.1018285. eCollection 2022. Front Oncol. 2022. PMID: 36300085 Free PMC article.
-
Construction and validation of a metabolism-associated gene signature for predicting the prognosis, immune landscape, and drug sensitivity in bladder cancer.BMC Med Genomics. 2023 Oct 26;16(1):264. doi: 10.1186/s12920-023-01678-6. BMC Med Genomics. 2023. PMID: 37880682 Free PMC article.
-
Exploration and validation of a novel reactive oxygen species-related signature for predicting the prognosis and chemotherapy response of patients with bladder cancer.Front Immunol. 2024 Dec 19;15:1493528. doi: 10.3389/fimmu.2024.1493528. eCollection 2024. Front Immunol. 2024. PMID: 39749345 Free PMC article.
-
The prognostic significance and immune characteristics of bone morphogenetic proteins (BMPs) family: A pan-cancer multi-omics analysis.Technol Health Care. 2024;32(6):4123-4175. doi: 10.3233/THC-232004. Technol Health Care. 2024. PMID: 39031404 Free PMC article.
-
Deciphering riddles in molecular subtyping of bladder cancer.Asian J Urol. 2025 Apr;12(2):217-231. doi: 10.1016/j.ajur.2024.09.006. Epub 2024 Dec 5. Asian J Urol. 2025. PMID: 40458574 Free PMC article. Review.
Cited by
-
Circular RNAs as Targets for Developing Anticancer Therapeutics.Cells. 2025 Jul 18;14(14):1106. doi: 10.3390/cells14141106. Cells. 2025. PMID: 40710359 Free PMC article. Review.
-
ADME gene-driven prognostic model for bladder cancer: a breakthrough in predicting survival and personalized treatment.Hereditas. 2025 Mar 19;162(1):42. doi: 10.1186/s41065-025-00409-4. Hereditas. 2025. PMID: 40108724 Free PMC article.
-
Integrating machine learning models with multi-omics analysis to decipher the prognostic significance of mitotic catastrophe heterogeneity in bladder cancer.Biol Direct. 2025 Apr 21;20(1):56. doi: 10.1186/s13062-025-00650-x. Biol Direct. 2025. PMID: 40259382 Free PMC article.
References
MeSH terms
Substances
LinkOut - more resources
Full Text Sources
Medical
Research Materials
Miscellaneous

