

Community characteristics and relationship between gut microbiota and intratumoral microbiota in hepatocellular carcinoma
- PMID: 39867901
- PMCID: PMC11757874
- DOI: 10.3389/fimmu.2024.1500863
Community characteristics and relationship between gut microbiota and intratumoral microbiota in hepatocellular carcinoma
Abstract
Background: The combination of local therapy with lenvatinib and programmed cell death protein-1 (PD-1) inhibitors represents an emerging treatment paradigm for unresectable hepatocellular carcinoma (uHCC). Our study sought to investigate the interrelationship between gut microbiota and intratumoral microbiota in the context of triple therapy, with a view to identifying potential biological markers.
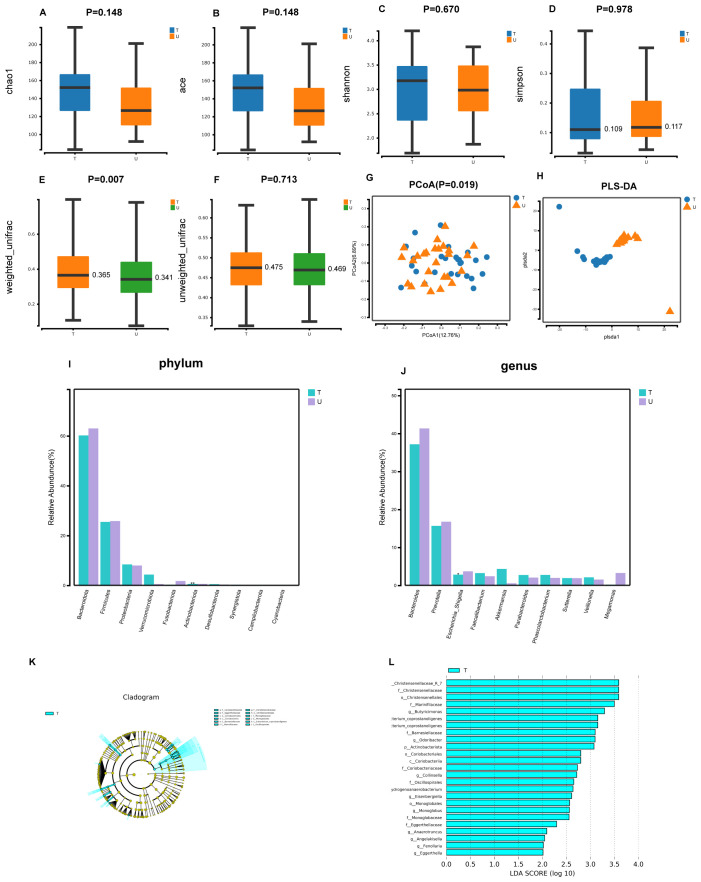
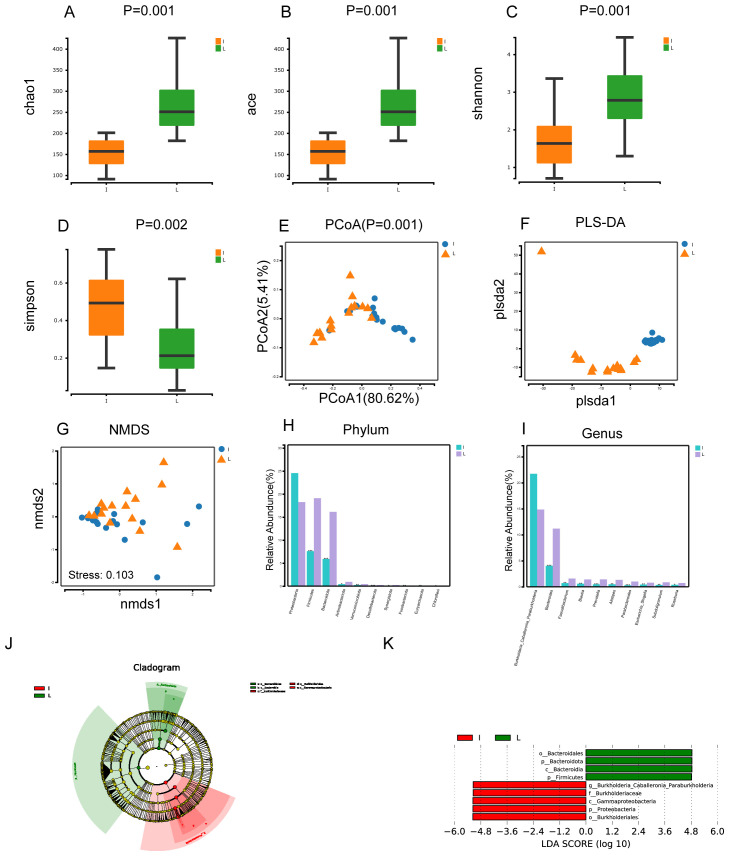
Methods: The gut microbial community profiles of patients with primary untreated hepatocellular carcinoma (HCC) and those treated with local therapy combined with lenvatinib and PD-1 inhibitors were analyzed by 16S rRNA gene amplicon sequencing. Additionally, microbial community profiles of tumor tissues of patients with HCC and normal liver tissues were analyzed.
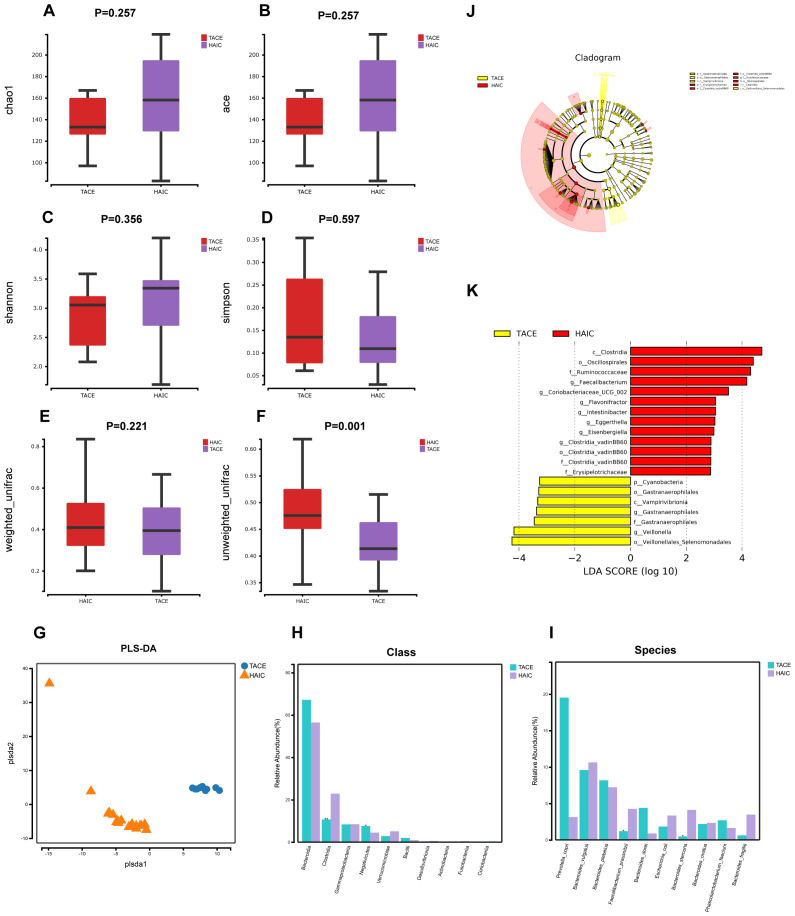
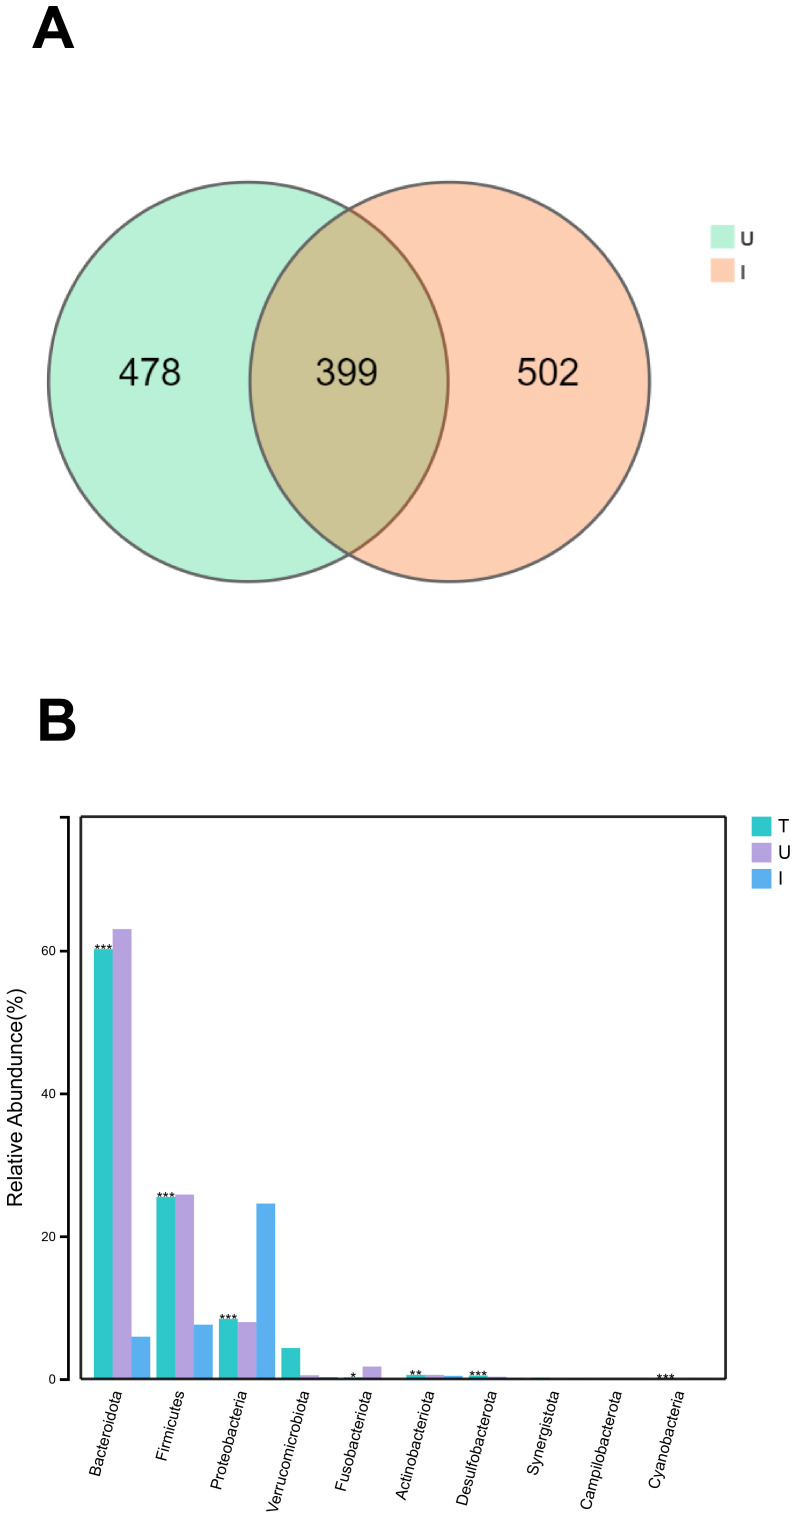
Results: In our investigation, we observed that patients with HCC who received triple therapy exhibited a notable enhancement in the abundance of Actinobacteriota and a considerable decrease in Escherichia Shigella. Patients who received hepatic artery infusion chemotherapy (HAIC) in combination with levatinib and PD-1 inhibitors exhibited significantly elevated levels of Faecalibacterium prausnitzii and Bacteroides stercoris in comparison to those who received transarterial chemoembolization (TACE) in combination with levatinib and PD-1 inhibitors. Furthermore, a notable decline in microbial diversity was observed within HCC tumors in comparison to normal liver tissues. The gut and intratumoral microbiota in HCC patients exhibited a high degree of similarity to the microbes present at the phylum level.
Conclusions: Gut microbiota is connected to triple therapy with local therapy combined with lenvatinib and PD-1 inhibitors for HCC. These discoveries underscore the potential of utilizing gut microbiota and intratumoral microbiota as biomarkers, as well as the possibility of triple therapy in the management of HCC.
Keywords: gut microbiota; hepatic artery infusion chemotherapy; hepatocellular carcinoma; intratumoral microbiota; lenvatinib; programmed cell death protein-1 inhibitors; transarterial chemoembolization.
Copyright © 2025 Lin, Ma, Li, Zhu, Huang, Chen, Tu, Lian and Su.
Conflict of interest statement
The authors declare that the research was conducted in the absence of any commercial or financial relationships that could be construed as a potential conflict of interest.
Figures
Similar articles
-
Hepatic arterial infusion chemotherapy, lenvatinib plus programmed cell death protein-1 inhibitors: A promising treatment approach for high-burden hepatocellular carcinoma.Cancer Med. 2024 May;13(9):e7105. doi: 10.1002/cam4.7105. Cancer Med. 2024. PMID: 38686567 Free PMC article.
-
Efficacy and Safety of Transarterial Chemoembolization Combined with Lenvatinib Plus Programmed Death-1 Inhibitor for Hepatocellular Carcinoma with the Hepatic Vein and/or Inferior Vena Cava Tumor Thrombus.Cardiovasc Intervent Radiol. 2025 Mar;48(3):314-326. doi: 10.1007/s00270-024-03919-2. Epub 2024 Dec 10. Cardiovasc Intervent Radiol. 2025. PMID: 39658748
-
The impact of PD-1 inhibitors on prognosis in unresectable hepatocellular carcinoma treated with TACE and lenvatinib: a retrospective study.Sci Rep. 2024 Jun 21;14(1):14334. doi: 10.1038/s41598-024-63571-1. Sci Rep. 2024. PMID: 38906915 Free PMC article.
-
Efficacy and safety of transarterial chemoembolization plus lenvatinib combined with PD-1 inhibitors versus transarterial chemoembolization plus lenvatinib for unresectable hepatocellular carcinoma: a meta-analysis.Front Immunol. 2024 Aug 30;15:1466113. doi: 10.3389/fimmu.2024.1466113. eCollection 2024. Front Immunol. 2024. PMID: 39281676 Free PMC article.
-
Combination Therapy Consisting of Transarterial Chemoembolization, Lenvatinib, and Programmed Cell Death Protein 1 Blockade for Hepatocellular Carcinoma with Inferior Vena Cava Tumor Thrombus: A Case Series Study and Literature Review.Oncol Res Treat. 2024;47(10):465-473. doi: 10.1159/000540662. Epub 2024 Aug 7. Oncol Res Treat. 2024. PMID: 39111295 Review.
Cited by
-
Analysis of risk factors for post-operative infection following drug-eluting trans arterial chemo embolization in hepatocellular carcinoma: A retrospective study.World J Gastrointest Surg. 2025 Jun 27;17(6):106276. doi: 10.4240/wjgs.v17.i6.106276. World J Gastrointest Surg. 2025. PMID: 40584472 Free PMC article.
References
-
- Feng JK, Liu ZH, Fu ZG, Chai ZT, Sun JX, Wang K, et al. . Efficacy and safety of transarterial chemoembolization plus antiangiogenic- targeted therapy and immune checkpoint inhibitors for unresectable hepatocellular carcinoma with portal vein tumor thrombus in the real world. Front Oncol. (2022) 12:954203. doi: 10.3389/fonc.2022.954203 - DOI - PMC - PubMed
MeSH terms
Substances
LinkOut - more resources
Full Text Sources
Medical
Research Materials
Miscellaneous