. 2025 Jan 10:15:1499551.
doi: 10.3389/fimmu.2024.1499551. eCollection 2024.

Interferon activation in bone marrow long-lived plasma cells in systemic lupus erythematosus

Affiliations

Interferon activation in bone marrow long-lived plasma cells in systemic lupus erythematosus

Diana F Alzamareh et al. Front Immunol. .

Abstract

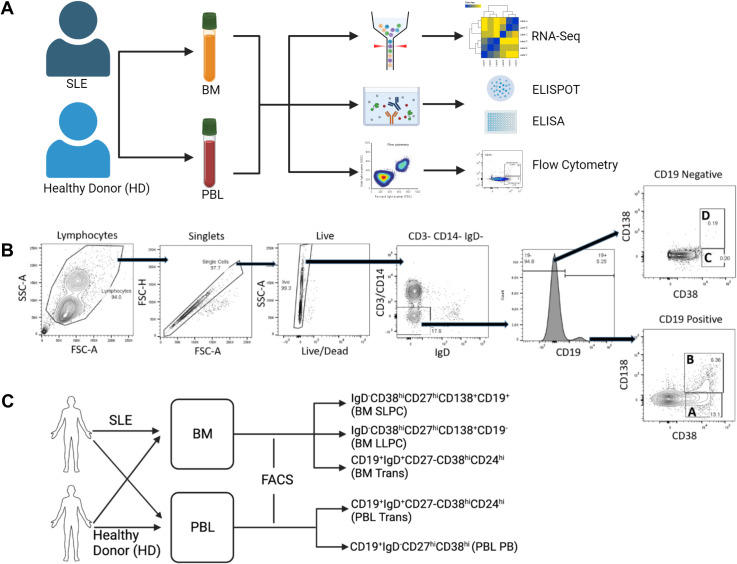
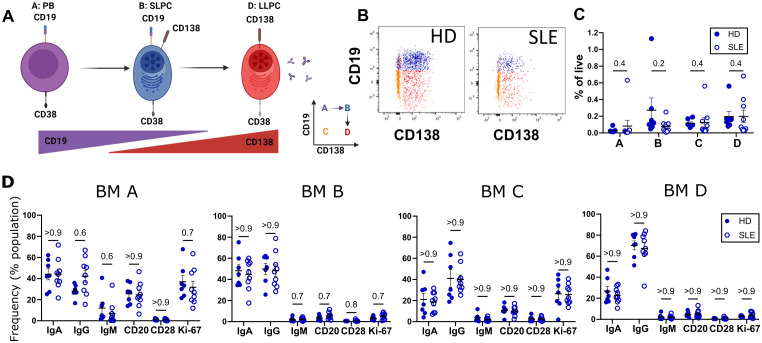
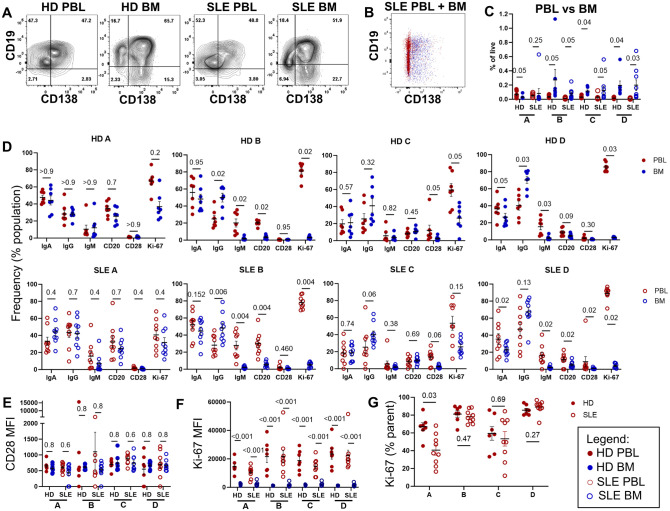
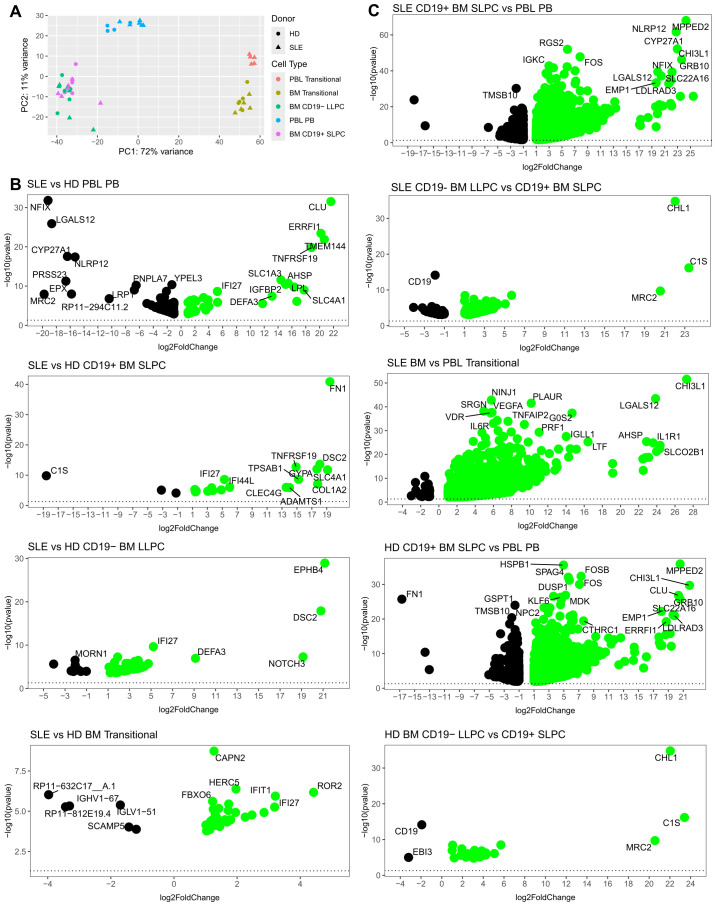
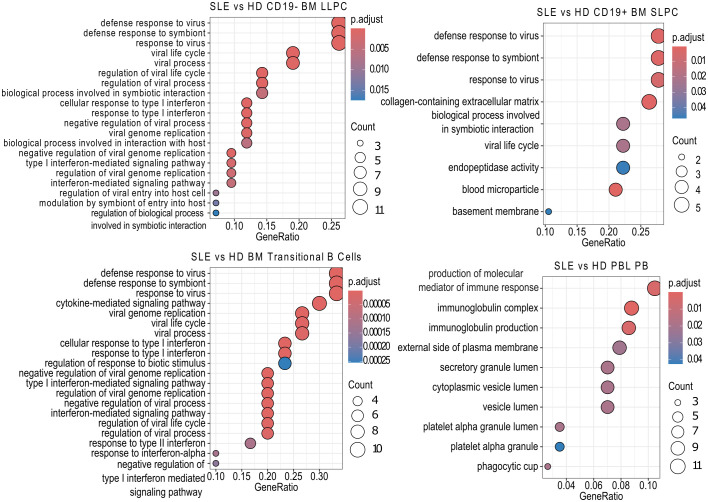
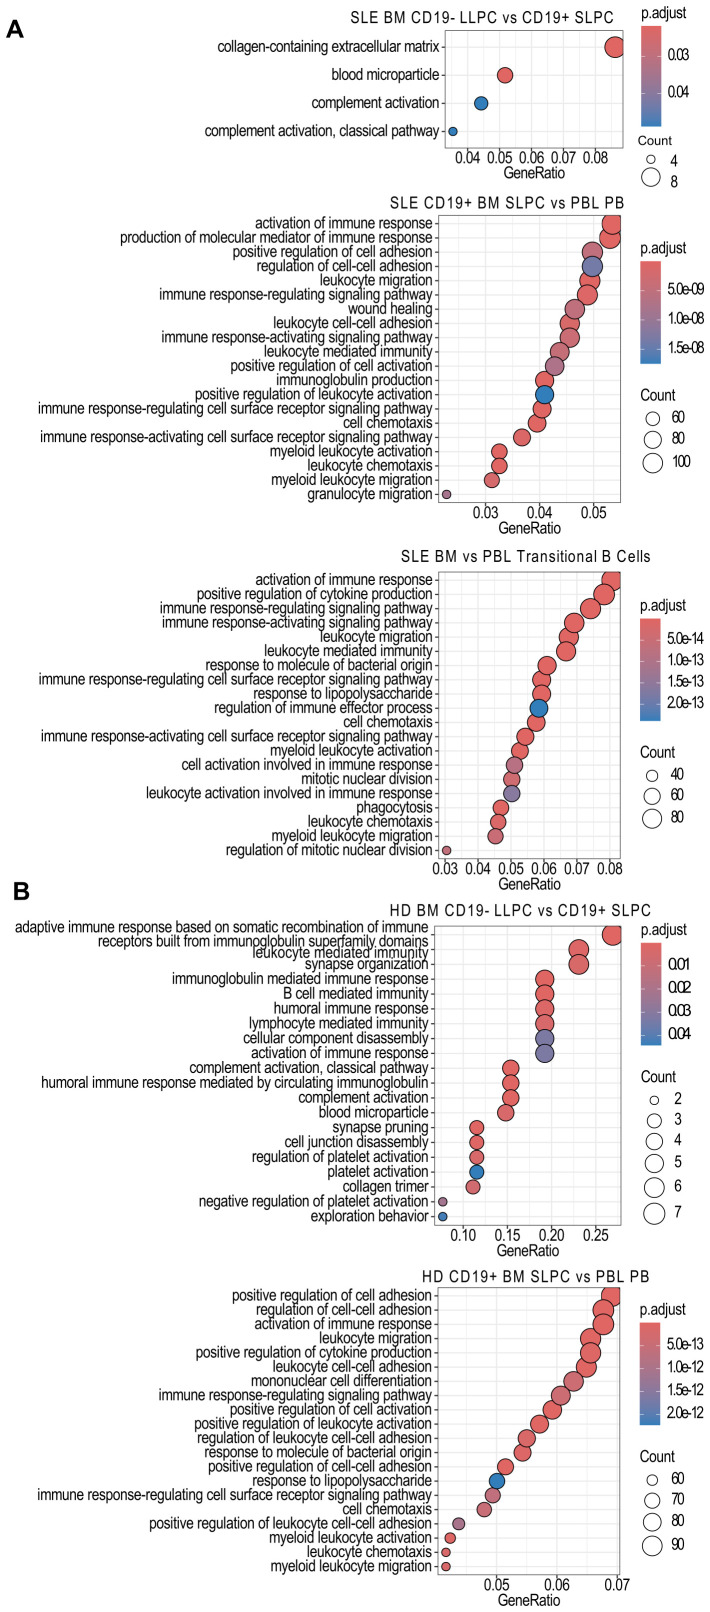
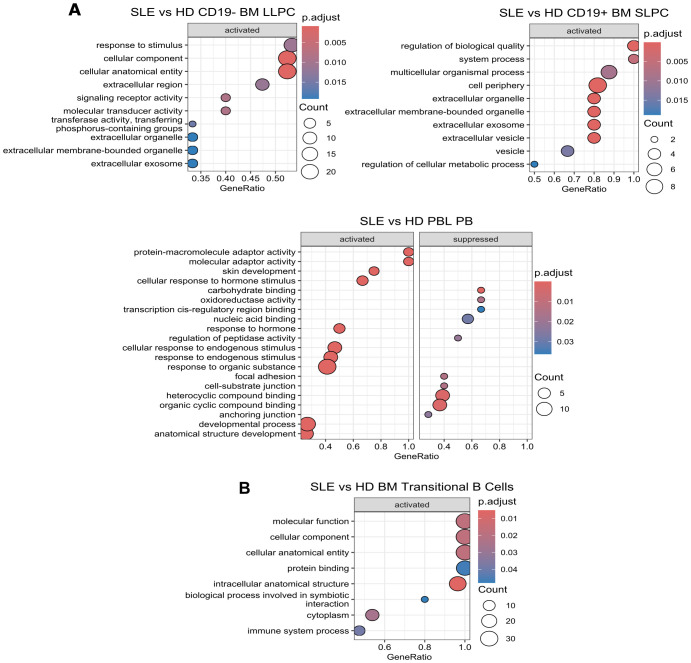
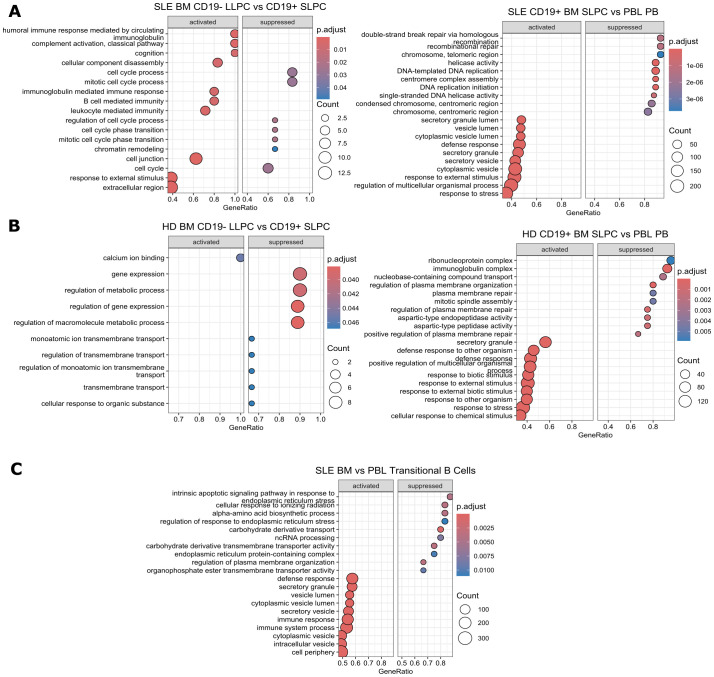
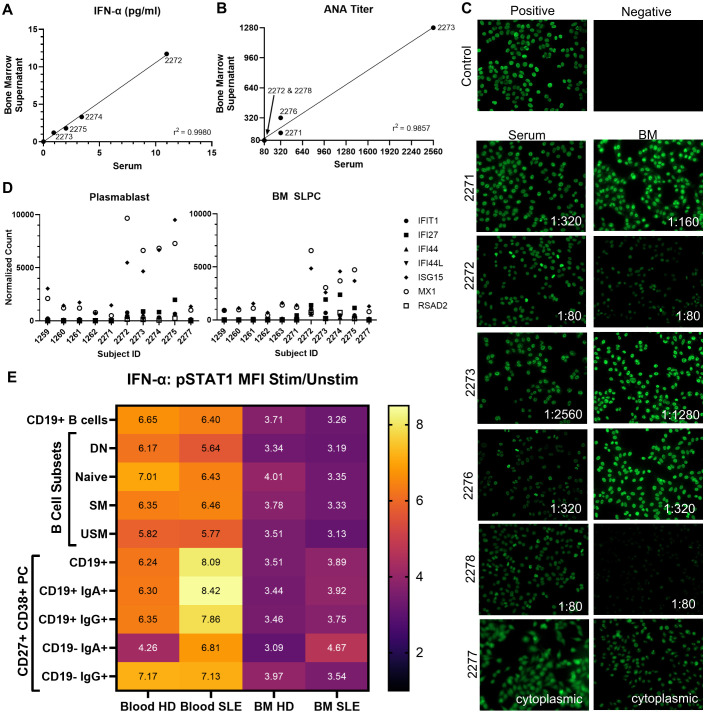
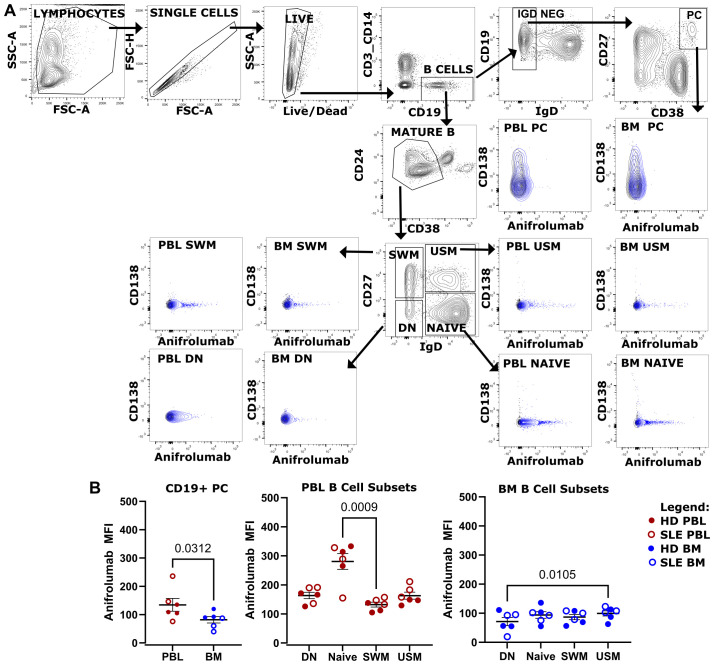
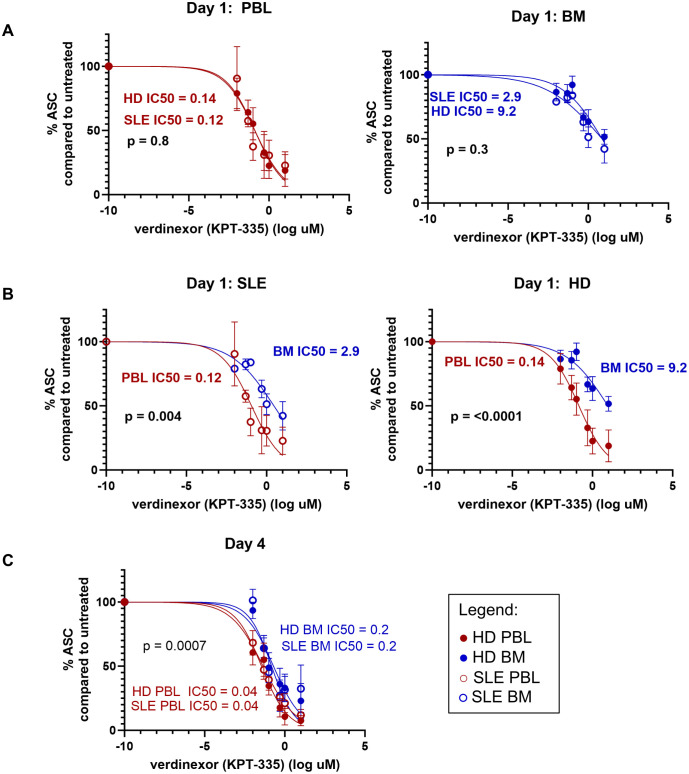
While durable antibody responses from long-lived plasma cell (LLPC) populations are important for protection against pathogens, LLPC may be harmful if they produce antibodies against self-proteins or self-nuclear antigens as occurs in autoimmune diseases such as systemic lupus erythematosus (SLE). Thus, the elimination of autoreactive LLPC may improve the treatment of antibody-driven autoimmune diseases. However, LLPC remain a challenging therapeutic target. Here, we compare the matched bone marrow (BM) and peripheral blood (PBL) plasma cell (PC) compartments of SLE and healthy donors (HD). We show a similar distribution of CD138- and CD138+ PC, including putative LLPC (CD19- CD138+ CD38+), between SLE and HD BM. For both SLE and HD, CD138+ PC are at a higher frequency in BM than PBL. Expression of Ki-67 associates with the PBL compartment where it is found on all PC subsets regardless of CD19 or CD138 expression. Transcriptomic analysis identifies an interferon (IFN) gene signature in transitional B cells in the SLE BM, but surprisingly also in the BM PC derived from SLE. BM PC and B cells phosphorylate STAT1 in response to type I IFN stimulation in vitro, but with decreased fold change compared to those from the PBL. While BM PC bind type I IFN receptor-blocking antibody anifrolumab, it is to a lesser degree than circulating B cells. Anti-nuclear autoantibodies (ANA) are found in the BM supernatant and PBL serum of SLE patients. Both SLE and HD BM-derived PC have increased survival compared to their PBL counterparts when treated with verdinexor. In summary, these findings show evidence of IFN activation in BM PC from SLE.

Keywords: B cell; anifrolumab; bone marrow; interferon; lupus (SLE); plasma cell (PC); transitional B cell; verdinexor.


Conflict of interest statement

The authors declare that the research was conducted in the absence of any commercial or financial relationships that could be construed as a potential conflict of interest. The author(s) declared that they were an editorial board member of Frontiers, at the time of submission. This had no impact on the peer review process and the final decision.

Figures

Figure 1
Figure 1
Experimental Overview. (A) Paired PBL and BM from HD or SLE donors were subjected to RNA-sequencing transcriptomic analysis, IgG ELISPOT, IFN ELISA and/or immunophenotyping by flow cytometry. (B) Representative flow cytometry PC population gating strategy. A sample derived from PBMC is shown. (B & C). PC fractions A, B, C, D are phenotyped in Figures 2 , 3 . (C) Sorting Strategy. Paired PBMC and BMMC were sorted into putative BM LLPC, BM SLPC, BM transitional B, PBL PB, and PBL transitional B cells by fluorescence activated cell sorting. Bulk transcriptomic analysis performed on these samples is shown in Figures 47 . Figure made with BioRender.com.
Figure 2
Figure 2
Immunophenotyping of SLE vs. HD BM. BM derived from 9 SLE (○) and 7 HD (⚫) analyzed by flow cytometry. (A) Putative differentiation cascade of ASC. A, B and D represent populations from gating in Figure 1B . Figure made with BioRender.com (B) Flow cytometry gates A (purple), B (blue), C (orange), and D (red) representing BM PC populations for HD and SLE backgated onto CD19 vs CD138 plot. (C) Frequency of BM populations A, B, C, and D as a % of live single cells. (D) Immunophenotyping of immunoglobulin isotypes (IgG, IgA, IgM) and markers (CD28, CD20, and Ki-67) as % of BM fraction A, B, C or D. Error bars indicate mean ± SEM. Statistics calculated as non-parametric Mann-Whitney Test between SLE and HD groups with q-values reported utilizing a two-stage set up Benjamini, Krieger, and Yekutieli correction.
Figure 3
Figure 3
Immunophenotyping of BM and PBL PC. Paired PBL (red) and BM (blue) derived from 9 SLE (○) and 7 HD controls (⚫) analyzed by flow cytometry via the gating strategy shown in Figure 1B . (A) Representative dot plots of CD19 and CD138 expression of CD14- CD3- IgD- CD24- CD27+ CD38+ PC from PBL and BM from HD and SLE donors. (B) Overlay of SLE PBL (red) and BM (blue) CD19 versus CD138 dotplots from single representative SLE subject. (C) Frequency of populations A, B, C, and D shown as a % of live single cells, with q-value shown for donor matched PBL vs BM comparison. (D) Immunophenotyping of immunoglobulin (IgA, IgG, IgM), CD20, CD28 or Ki-67 markers shown a % of the parent PC fraction. (E, F) MFI of PC fraction shown for (E) CD28 and (F) Ki-67 expression. (G) Frequency of Ki-67+ cells in each population of PC within PBL. For all graphs, each point represents data from single donor. Error bars indicate mean ± SEM. Statistics calculated as non-parametric Wilcoxon matched-pairs signed rank test for PBL versus BM comparisons within donors. For all graphs, q-values are reported utilizing a two-stage set up (Benjamini, Krieger, and Yekutieli) correction after either Mann-Whitney (HD vs. SLE) or Wilcoxon matched-pairs signed rank test (PBL vs. BM, matched by donor).
Figure 4
Figure 4
Differential Gene Expression Analysis of SLE and HD BM and PBL PC and transitional B cells. To minimize the impact of sex-associated genes on downstream analysis, a filtering scheme was applied such that genes had to be present in >9 samples and have a count of at least 10 copies. (A) Principal Component Analysis (PCA) of normalized expression data. Donor type represented by shape with triangle for SLE and circle for HD. Color denotes cell type. (B, C) Volcano plots with top 30 differentially expressed genes annotated for (B) SLE vs. HD (left) where green indicates upregulated in SLE and (C) BM vs. PBL (right) where green indicates upregulated in BM.
Figure 5
Figure 5
SLE vs HD Over Representation Analysis. Using the clusterProfiler enrichGOALL function, pathway enrichment analysis was performed on bulk RNA-sequencing samples differentially expressed genes using the Gene Ontology (GO) database using with an unranked gene list by cell type. The twenty most significantly upregulated pathways are displayed with a p-value cut off of 0.05 and q-value cut off of 0.2 using Benjamini & Hochberg correction (fdr). Size of dot indicates number of genes upregulated in the pathway while color indicates adjusted p-value. GeneRatio indicates the number of genes in the input list associated with the GO pathway divided by the number of input genes.
Figure 6
Figure 6
Over Representation Analysis Comparisons Between Cell Subsets. Using the clusterProfiler enrichGOALL function, pathway enrichment analysis was performed on bulk RNA-sequencing samples differentially expressed genes using the GO database using with an unranked gene list between (A) SLE PC or transitional B cell subsets or (B) HD PC subset comparisons. The twenty most significantly upregulated pathways are displayed with a p-value cut off of 0.05 and q-value cut off of 0.2 using Benjamini & Hochberg correction (fdr). Size of dot indicates number of genes upregulated in the pathway while color indicates adjusted p-value. GeneRatio indicates the number of genes in the input list associated with the GO pathway divided by the number of input genes.
Figure 7
Figure 7
SLE vs HD Gene Set Enrichment Analysis. Using clusterProfiler, GSEA analysis was performed on differentially expressed genes with function gseGO using the GO database which requires an order ranked gene list on SLE vs. HD comparisons by cell type for (A) BM (top) and PBL (bottom) PC subsets and (B) BM transitional B cells. Genes were ranked by log2fold change. The twenty most significantly enriched pathways are displayed with a p-value cut off of 0.05 and q-value cut off of 0.2 using Benjamini & Hochberg correction (fdr). Size of dot indicates number of genes upregulated in the pathway while color indicates adjusted p-value. GeneRatio indicates the number of genes in the input list associated with the GO pathway divided by the number of input genes.
Figure 8
Figure 8
Gene Set Enrichment Analysis Comparisons Between Cell Subsets. Using clusterProfiler, GSEA analysis was performed on differentially expressed genes with function gseGO using the GO database which requires an order ranked gene list between cell types for comparisons within (A) SLE PC subsets, (B) HD PC subsets, and (C) SLE BM vs. PBL transitional B cells. Genes were ranked by log2fold change. The twenty most significantly enriched pathways are displayed with a p-value cut off of 0.05 and q-value cut off of 0.2 using Benjamini & Hochberg correction (fdr). Size of dot indicates number of genes upregulated in the pathway while color indicates adjusted p-value. GeneRatio indicates the number of genes in the input list associated with the GO pathway divided by the number of input genes.
Figure 9
Figure 9
PBL versus BM Relationship with IFN-α and ANA. (A) Serum and BM IFN-α levels correlate (spearman r =1, p=<0.0001, n=16, 7 HD, 9 SLE). (B) Serum and BM ANA titer correlate (spearman 0.9733, p=0.033). For A-B, subject IDs of positive samples and simple linear regression coefficient shown. (C) ANA immunofluorescence in serum and BM supernatant (7 HD, 9 SLE). Lowest titer by which fluorescence still visible shown for positive samples. (D) IFN Stimulated Genes normalized counts from bulk RNA-seq from CD19+ BM SLPC and PBL PB. HD represented by 1259 to 1263 and SLE 2271 to 2277. (E) SLE and HD PBL and BM B cells and PC signal in response to IFN-α stimulation. Heat map of mean pSTAT1 MFI IFN-α Stimulated/Unstimulated Fold Change (n=6 HD, n=6 SLE) by flow cytometry shown. All CD19+ subsets had q-value of 0.03 between PBL and BM pSTAT1 fold change using Wilcoxon matched-pairs signed rank test with a two-stage step up false discovery approach by Benjamin, Krieger and Yekutiel. Differences between CD19- IgA+ or CD19- IgG+ were not significant for SLE versus HD or paired PBL versus BM tests. Mann-Whitney tests used between HD and SLE for PBL or BM subsets were not significant.
Figure 10
Figure 10
Anifrolumab binds B cell and PC. (A) Flow cytometry phenotyping of canonical B cell subsets and CD19+ PC using a panel containing fluorescently labeled anifrolumab using gating strategy shown. Overlay shown of anifrolumab containing panel (blue) overlaying fluorescence minus 1 control (black) which did not include anifrolumab. BM and PBL from same donor shown. (B) Anifrolumab MFI of CD19+ PC in PBL vs BM (left), PBL B cell (middle, red) and BM B cell subsets (right, blue) for pooled HD (○, n=3) and SLE (⚫, n=3). Wilcoxon test p-value shown for PC PBL vs BM. Friedman test with Dunn’s multiple comparison test q-values shown for canonical B cell subsets.
Figure 11
Figure 11
BM ASC have enhanced survival compared to PBL ASC. Surviving IgG+ ASC were enumerated by IgG ELISPOT after in vitro treatment of MC with SINE inhibitor KPT-335. Dose response curves for (A) Day 1 HD (⚫) vs. SLE (○) for PBL (red, left) and BM (blue, right); (B) Day 1 BM vs. PBL for SLE (left, ○) and HD (right, ⚫) and (C) Day 4 all sources. The Extra Sum of Squares F Test was used to determine if the LogIC50 was different between data sets. X data was normalized to the mean number of ASC detected in the untreated wells for each subject. Data was fit using the log of verdinexor concentrations with a variable slope model for normalized data and logarithmic concentration of inhibitor [Y=100/(1 + 10^((LogIC50-X)*HillSlope)))]. As log of 0 is undefined, -10 was input for untreated samples.

Similar articles

Cited by

  • Targeting proteostasis in multiple myeloma through inhibition of LTK.
    Våtsveen TK, Giliberto M, Bjornsdottir V, Centonze F, Besse A, Frey Y, Skånland SS, Tveita A, Alirezaylavasani A, Imbery JF, Misund K, Reiterer V, Zahoor M, Driessen C, Besse L, Tasken K, Schjesvold FH, Farhan H, Munthe LA. Våtsveen TK, et al. Leukemia. 2025 Jul 9. doi: 10.1038/s41375-025-02682-8. Online ahead of print. Leukemia. 2025. PMID: 40634511

References

    1. Odendahl M, Jacobi A, Hansen A, Feist E, Hiepe F, Burmester GR, et al. . Disturbed peripheral B lymphocyte homeostasis in systemic lupus erythematosus. J Immunol (Baltimore Md: 1950). (2000) 165:5970–9. doi: 10.4049/jimmunol.165.10.5970 - DOI - PubMed
    1. Grammer AC, Lipsky PE. B cell abnormalities in systemic lupus erythematosus. Arthritis Res Ther. (2003) 5 Suppl 4:S22–7. doi: 10.1186/ar1009 - DOI - PMC - PubMed
    1. Landsverk OJB, Snir O, Casado RB, Richter L, Mold JE, Réu P, et al. . Antibody-secreting plasma cells persist for decades in human intestine. J Exp Med. (2017) 214:309–17. doi: 10.1084/jem.20161590 - DOI - PMC - PubMed
    1. Jacob J, Kassir R, Kelsoe G. In situ studies of the primary immune response to (4-hydroxy-3-nitrophenyl)acetyl. I. The architecture and dynamics of responding cell populations. J Exp Med. (1991) 173:1165–75. doi: 10.1084/jem.173.5.1165 - DOI - PMC - PubMed
    1. Smith KG, Hewitson TD, Nossal GJ, Tarlinton DM. The phenotype and fate of the antibody-forming cells of the splenic foci. Eur J Immunol. (1996) 26:444–8. doi: 10.1002/eji.1830260226 - DOI - PubMed