Glycosylation profiling of triple-negative breast cancer: clinical and immune correlations and identification of LMAN1L as a biomarker and therapeutic target
- PMID: 39867909
- PMCID: PMC11759290
- DOI: 10.3389/fimmu.2024.1521930
Glycosylation profiling of triple-negative breast cancer: clinical and immune correlations and identification of LMAN1L as a biomarker and therapeutic target
Abstract
Introduction: Breast cancer (BC) is the most prevalent malignant tumor in women, with triple-negative breast cancer (TNBC) showing the poorest prognosis among all subtypes. Glycosylation is increasingly recognized as a critical biomarker in the tumor microenvironment, particularly in BC. However, the glycosylation-related genes associated with TNBC have not yet been defined. Additionally, their characteristics and relationship with prognosis have not been deeply investigated.
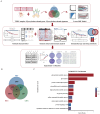
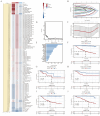
Methods: Transcriptomic analyses were used to identify a glycosylation-related signature (GRS) associated with TNBC prognosis. A machine learning-based prediction model was constructed and validated across multiple independent datasets. The model's predictive capability was extended to evaluate the prognosis of TNBC individuals, tumor immune microenvironment and immunotherapy response. LMAN1L (Lectin, Mannose Binding 1 Like) was identified as a novel prognostic marker in TNBC, and its biological effects were validated through experimental assays.
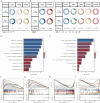
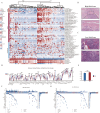
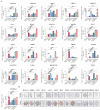
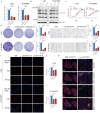
Results: The GRS showed significant prognostic relevance for TNBC patients. The risk model effectively predicted molecular features, including immune cell infiltration and potential responses to immunotherapy. Experimental validation confirmed LMAN1L as a novel glycosylation-related prognostic gene, with low expression significantly inhibiting TNBC cell proliferation and migration.
Discussion: Our GRS risk model demonstrates robust predictive capability for TNBC prognosis and immunotherapy response. This model offers a promising strategy for personalized treatment and improved clinical outcomes in TNBC.
Keywords: TNBC; glycosylation; machine learning; prognosis; tumor immune microenvironment.
Copyright © 2025 Yu, Zhong, Zhu, Liu, Zhang, Wang, Li, Shi, Zhao, Zhou and Zhao.
Conflict of interest statement
The authors declare that the research was conducted in the absence of any commercial or financial relationships that could be construed as a potential conflict of interest.
Figures

Similar articles
-
Construction of a stromal cell-related prognostic signature based on a 101-combination machine learning framework for predicting prognosis and immunotherapy response in triple-negative breast cancer.Front Immunol. 2025 May 14;16:1544348. doi: 10.3389/fimmu.2025.1544348. eCollection 2025. Front Immunol. 2025. PMID: 40438115 Free PMC article.
-
ALG3 predicts poor prognosis and increases resistance to anti-PD-1 therapy through modulating PD-L1 N-link glycosylation in TNBC.Int Immunopharmacol. 2024 Oct 25;140:112875. doi: 10.1016/j.intimp.2024.112875. Epub 2024 Aug 9. Int Immunopharmacol. 2024. PMID: 39116492
-
Integrated machine learning algorithms identify KIF15 as a potential prognostic biomarker and correlated with stemness in triple-negative breast cancer.Sci Rep. 2024 Sep 13;14(1):21449. doi: 10.1038/s41598-024-72406-y. Sci Rep. 2024. PMID: 39271768 Free PMC article.
-
Clinical relevance of glycosylation in triple negative breast cancer: a review.Glycoconj J. 2024 Apr;41(2):79-91. doi: 10.1007/s10719-024-10151-0. Epub 2024 Apr 18. Glycoconj J. 2024. PMID: 38634956 Review.
-
Immunotherapy for triple-negative breast cancer: Existing challenges and exciting prospects.Drug Resist Updat. 2017 May;32:1-15. doi: 10.1016/j.drup.2017.07.002. Epub 2017 Aug 19. Drug Resist Updat. 2017. PMID: 29145974 Review.
References
-
- Brown M, Tsodikov A, Bauer KR, Parise CA, Caggiano V. The role of human epidermal growth factor receptor 2 in the survival of women with estrogen and progesterone receptor-negative, invasive breast cancer: the california cancer registry, 1999-2004. Cancer. (2008) 112:737–47. doi: 10.1002/cncr.23243 - DOI - PubMed
-
- Lin NU, Vanderplas A, Hughes ME, Theriault RL, Edge SB, Wong YN, et al. . Clinicopathologic features, patterns of recurrence, and survival among women with triple-negative breast cancer in the national comprehensive cancer network. Cancer. (2012) 118:5463–72. doi: 10.1002/cncr.27581 - DOI - PMC - PubMed
MeSH terms
Substances
LinkOut - more resources
Full Text Sources

