. 2025 Jan 10:15:1473815.
doi: 10.3389/fimmu.2024.1473815. eCollection 2024.

Generation and characterization of OX40-ligand fusion protein that agonizes OX40 on T-Lymphocytes

Affiliations

Generation and characterization of OX40-ligand fusion protein that agonizes OX40 on T-Lymphocytes

Ayaka Sato et al. Front Immunol. .

Abstract

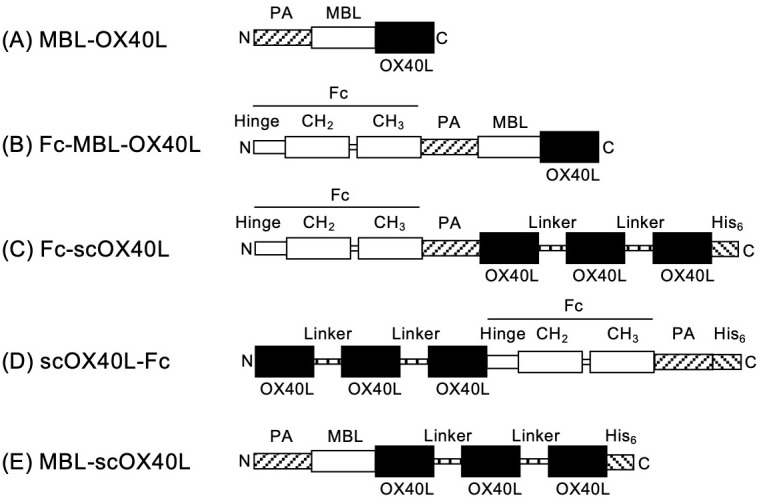
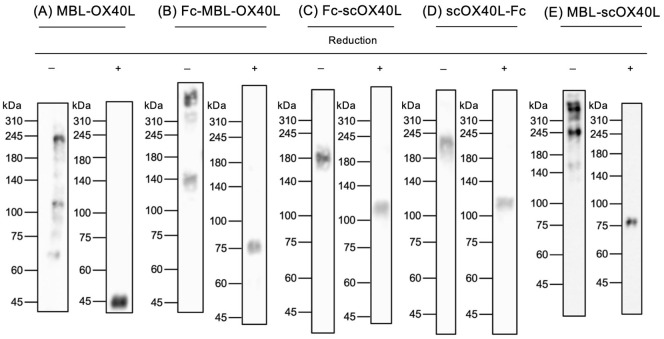
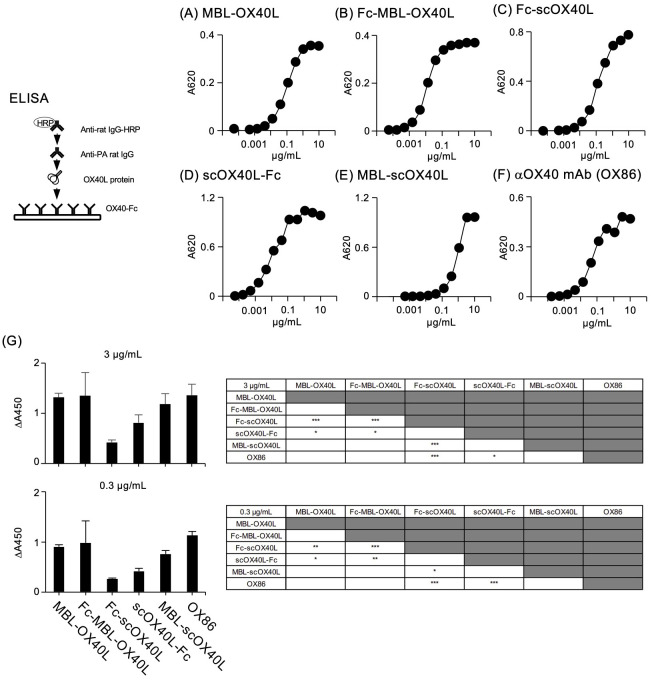
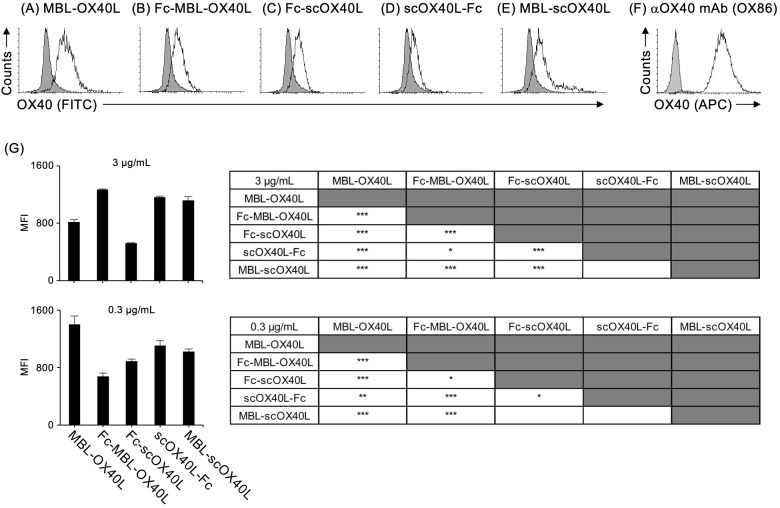
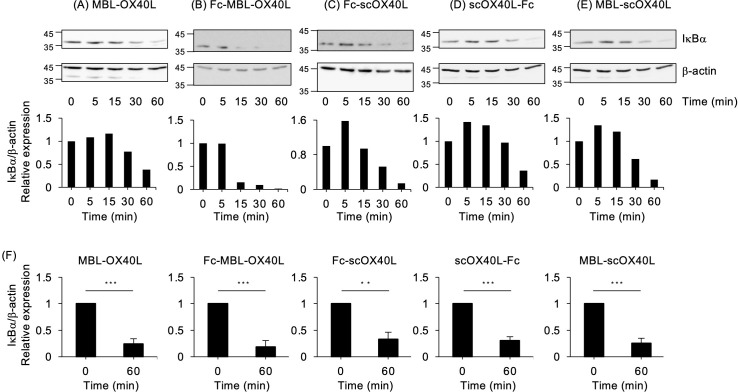
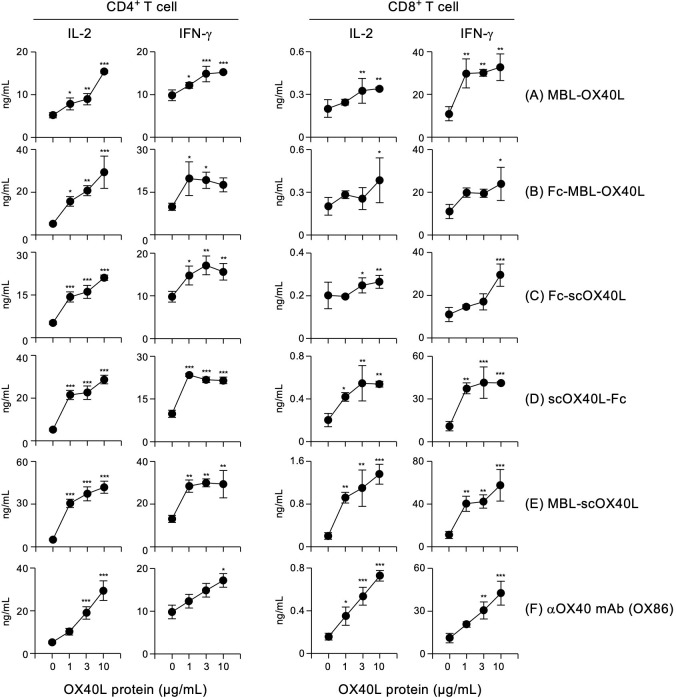
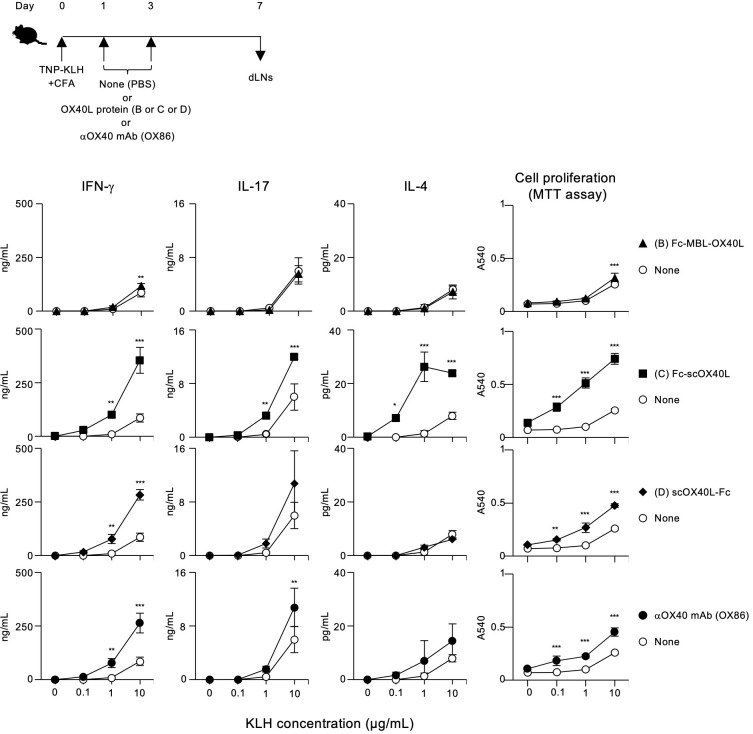
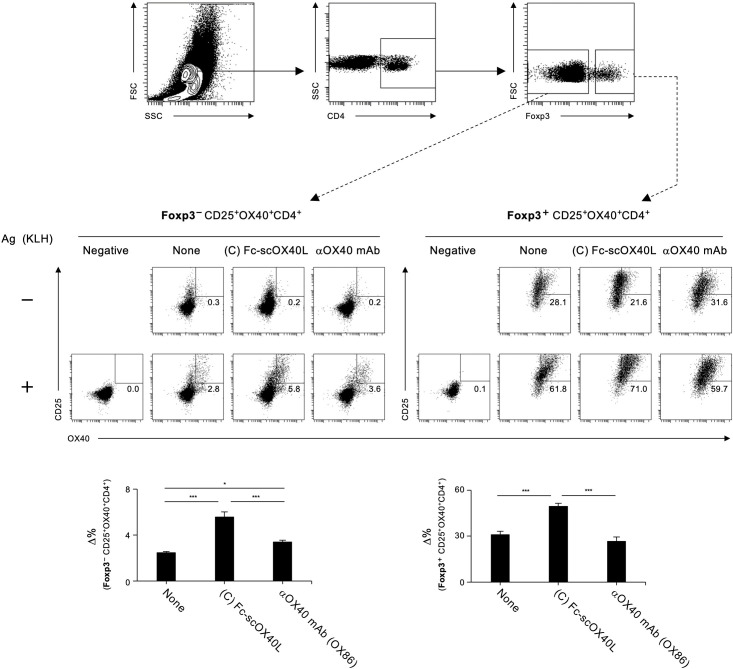
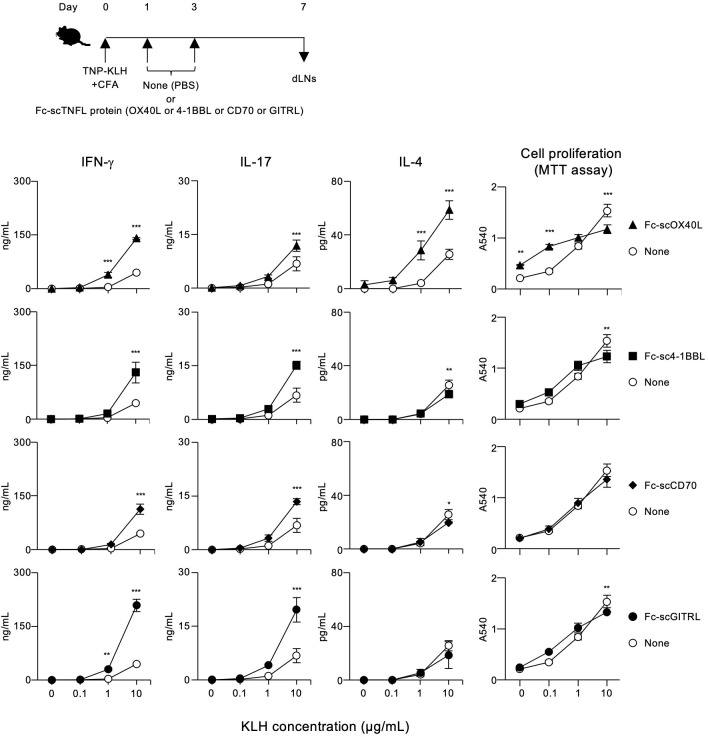
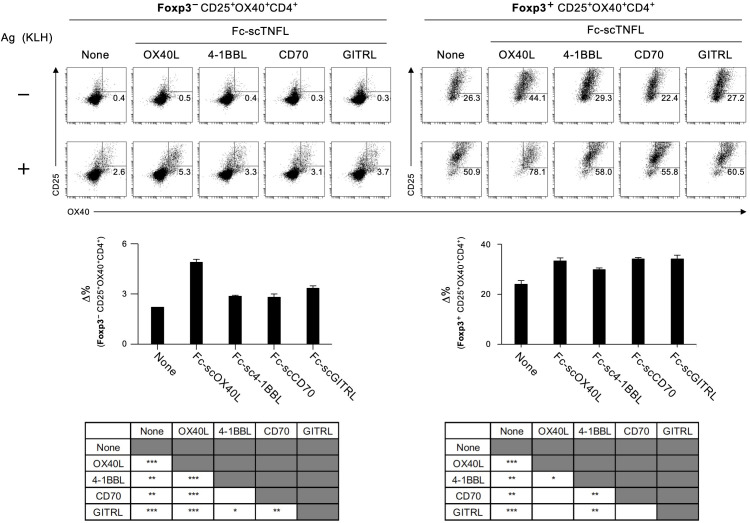
OX40, a member of the tumor necrosis factor (TNF) receptor superfamily, is expressed on the surface of activated T cells. Upon interaction with its cognate ligand, OX40L, OX40 transmits costimulatory signals to antigen-primed T cells, promoting their activation, differentiation, and survival-processes essential for the establishment of adaptive immunity. Although the OX40-OX40L interaction has been extensively studied in the context of disease treatment, developing a substitute for the naturally expressed membrane-bound OX40L, particularly a multimerized OX40L trimers, that effectively regulates OX40-driven T cell responses remains a significant challenge. In this study, we successfully engineered soluble OX40L-fusion proteins capable of robustly activating OX40 on T cells. This was achieved by incorporating functional multimerization domains into the TNF homology domain of OX40L. These OX40L proteins bound to OX40, subsequently activated NF-κB signaling, and induced cytokine production by T cells in vitro. In vivo, mice treated with one of the OX40L-fusion proteins-comprising a single-chain OX40L trimer linked to the C-terminus of the human IgG1 Fc domain, forming a dimer of trimers-exhibited significantly enhanced clonal expansion of antigen-specific CD4+ T cells during the primary phase of the immune response. A comparable antibody-fusion single-chain TNF protein incorporating 4-1BBL, CD70 (CD27L), or GITRL in place of OX40L elicited similar in vivo T cell responses. Thus, we propose that optimizing the multimerization of OX40L proteins through innovative design strategies may facilitate the development of more effective agonists for targeted immunotherapies.

Keywords: OX40; OX40L; T cell; TNF receptor superfamily; TNF superfamily; agonist; co-stimulation.


Conflict of interest statement

The authors declare that the research was conducted in the absence of any commercial or financial relationships that could be consulted as a potential conflict of interest. The author(s) declared that they were an editorial board member of Frontiers, at the time of submission. This had no impact on the peer review process and the final decision.

Figures

Figure 1
Figure 1
Schematic representation of OX40L-fusion proteins. The domain structures of the respective OX40L-fusion proteins are as follows: (A) MBL-OX40L [PA peptide tag (PA, GVAMPGAEDDVV), collagen-like domain of mannose-binding lectin (MBL, 18Ser-126Gly), and extracellular TNF homology domain of OX40L (OX40L, 51Ser-198Leu)]; (B) Fc-MBL-OX40L [Fc (hinge, CH2, and CH3 domains of human IgG1), PA, MBL, and OX40L]; (C) Fc-scOX40L [Fc, PA, OX40L, GGGSGGG peptide linker (Linker), OX40L, Linker, OX40L, and histidine peptide tag (His6, HHHHHH)]; (D) scOX40L-Fc [OX40L, Linker, OX40L, Linker, OX40L, Fc, PA, and His6]; (E) MBL-scOX40L [PA, MBL, OX40L, Linker, OX40L, Linker, OX40L, and His6]. The nucleotide sequences of the OX40L-fusion proteins are shown in Supplementary Figure S1 .
Figure 2
Figure 2
Immunoblot analysis of OX40L-fusion proteins. Five different OX40L-fusion proteins (A-E) were analyzed by immunoblotting using anti-PA tag antibody under non-heated/non-reducing (-) and heated/reducing (+) conditions. The migration positions of molecular weight markers (kDa) are shown on the left side of each gel. The expected molecular weights of the reduced OX40L-fusion proteins, based on their amino acid sequences, are as follows: (A) MBL-OX40L (29 kDa); (B) Fc-MBL-OX40L (55 kDa); (C) Fc-scOX40L (79 kDa); (D) scOX40L-Fc (72 kDa); and (E) MBL-scOX40L (64 kDa). The discrepancy between the observed molecular masses and the calculated masses is suggested to be derived from glycosylation in OX40L (N91, UniProt P43488), MBL (K80 and K83, UniProt P39039), and Fc (N299, UniProt P0DOX5) proteins.
Figure 3
Figure 3
Binding of OX40L-fusion proteins to OX40-Fc, as evaluated by ELISA. Serially diluted OX40L-fusion proteins, including MBL-OX40L (A), Fc-MBL-OX40L (B), Fc-scOX40L (C), scOX40L-Fc (D), and MBL-scOX40L (E), were added to ELISA wells precoated with OX40-Fc, and binding was detected using anti-PA rat IgG and anti-rat IgG-HRP. Anti-OX40 antibody (OX86) (F) was used as a positive control. Data are from one experiment that is representative of at least two independent experiments with similar results. (G) Comparison of the binding activity of OX40L-fusion proteins and OX86 toward OX40-Fc, evaluated by ELISA. Respective OX40L-fusion proteins and OX86 proteins at concentrations of 3 µg/mL or 0.3 µg/mL were used to detect binding. The background absorbance was subtracted from the absorbances of the corresponding samples (n = 4) (ΔA450). Similar results were obtained at 0.03 µg/mL of the respective proteins. *p < 0.05, **p < 0.01, and ***p < 0.001 indicate statistically significant differences among the groups as determined by the Tukey-Kramer test.
Figure 4
Figure 4
Binding activity of OX40L-fusion proteins to cell surface OX40, as evaluated by flow cytometry. The OX40-expressing T cell hybridoma was stained with the respective OX40L-fusion proteins, MBL-OX40L (A), Fc-MBL-OX40L (B), Fc-scOX40L (C), scOX40L-Fc (D), and MBL-scOX40L (E). The OX40L-OX40 interaction was detected using anti-PA rat IgG and anti-rat IgG-FITC. Anti-OX40 antibody (OX86) (F) was used as a positive staining control. The negative staining control is shown as a shaded histogram. Data are from one experiment representative of at least two independent experiments with similar results. (G) Comparison of the binding activity of OX40L-fusion proteins to cell surface OX40, evaluated by flow cytometry and expressed as mean fluorescent intensity (MFI). OX40L-fusion proteins at concentrations of 3 µg/mL or 0.3 µg/mL were used to assess binding (n = 3). *p < 0.05, **p < 0.01, and ***p < 0.001 indicate statistically significant differences among the groups as determined by the Tukey-Kramer test.
Figure 5
Figure 5
NF-κB activation mediated by OX40L-fusion proteins, as evaluated by immunoblotting. The OX40-expressing T cell hybridoma was incubated with 30 µg/mL of the respective OX40L-fusion proteins, MBL-OX40L (A), Fc-MBL-OX40L (B), Fc-scOX40L (C), scOX40L-Fc (D), and MBL-scOX40L (E), for the indicated times. The cell lysate, equivalent to 4×10⁴ cells per well, was applied to an SDS-PAGE gel for electrophoresis, followed by transfer to a PVDF membrane. The protein expression of IκBα and β-actin was evaluated by immunoblotting (upper). The densitometric ratio of the IκBα band to the corresponding β-actin is shown (lower). Data are from one experiment representative of at least two independent experiments with similar results. (F) The densitometric ratio of IkBα band to the corresponding β-actin in OX40-exprerssing T cell hybridoma stimulated with the respective OX40L proteins for 60 min. Data are from three independent experiments. **p < 0.01 and ***p < 0.001 indicate statistically significant differences between the stimulated and unstimulated conditions, as determined by the Student’s t-test test.
Figure 6
Figure 6
Dose-dependency of OX40L-fusion proteins for the induction of IL-2 and IFN-g from CD4+ and CD8+ T cells. CD4+ (left) or CD8+ (right) T cells (5×10⁴ cells/well), purified from the spleens of C57BL/6 mice, were cultured in 96-well flat-bottom plates precoated with 10 µg/mL anti-CD3 antibody, with or without the indicated concentrations of the respective OX40L-fusion proteins, MBL-OX40L (A), Fc-MBL-OX40L (B), Fc-scOX40L (C), scOX40L-Fc (D), MBL-scOX40L (E), and anti-OX40 agonistic monoclonal antibody (OX86) (F) for 3 days. The concentrations of IL-2 and IFN-g in the culture supernatants were determined by ELISA. Data are presented as the mean ± standard deviation (n = 3) from one experiment representative of at least two independent experiments with similar results. *p < 0.05, **p < 0.01, and ***p < 0.001 indicate significant differences between conditions with and without OX40L stimulation (Dunnett’s test).
Figure 7
Figure 7
Enhanced antigen-specific effector T cell responses mediated by OX40L-fusion proteins. The experimental schedule for the induction of antigen-specific T cell responses is shown (upper). C57BL/6 mice were subcutaneously immunized with 100 µg of TNP-KLH emulsified in CFA on day 0, and then intraperitoneally injected twice with 20 µg of the respective OX40L-fusion proteins, Fc-MBL-OX40L, Fc-scOX40L, and scOX40L-Fc, on days 1 and 3. Anti-OX40 antibody (OX86) was used as a positive control. Popliteal draining lymph nodes (dLNs) were harvested on day 7. Pooled dLN cells from three mice per group were cultured with the indicated concentrations of KLH for 3 days. Cell proliferation was evaluated using the MTT assay. Cytokine concentrations were determined by ELISA. Data are presented as the mean ± standard deviation (n = 3) from one experiment representative of at least two independent experiments with similar results. *p < 0.05, **p < 0.01, and ***p < 0.001 indicate significant differences between the OX40L-injected group and the control (PBS) group at the respective antigen concentrations (Tukey-Kramer test).
Figure 8
Figure 8
Quantification of antigen-specific CD4+ T cell responses mediated by OX40L-fusion proteins using the AIM assay. The gating strategy for identifying antigen-responsive, activated OX40+CD25+ cells within CD4+Foxp3- and CD4+Foxp3+ populations in dLN cells is shown. dLN cells, as described in Figure 7 , were cultured in the absence (-) or presence (+) of 5 µg/mL KLH for 18 hours. Representative plots of OX40+CD25+ cells from CD4+Foxp3- (left) and CD4+Foxp3+ (right) with (+) or without (-) antigen restimulation are shown. The Δ% value was calculated by subtracting the proportion of OX40+CD25+ cells without antigen stimulation from the proportion of OX40+CD25+ cells with antigen stimulation. Data are presented as the mean ± standard deviation (n = 3) from one experiment representative of at least two independent experiments with similar results. *p < 0.05, and ***p < 0.001 indicate statistically significant differences among the groups as determined by the Tukey-Kramer test.
Figure 9
Figure 9
Enhanced antigen-specific effector T cell responses mediated by Fc-scTNFL proteins. The experimental schedule for the induction of antigen-specific T cell responses is shown (upper). C57BL/6 mice were subcutaneously immunized with 100 µg of TNP-KLH emulsified in CFA on day 0, and then intraperitoneally injected twice with 10 µg of the respective Fc-scTNFL proteins, Fc-scOX40L, Fc-sc4-1BBL, Fc-scCD70, and Fc-scGITRL, on days 1 and 3. Popliteal dLNs were harvested on day 7. Pooled dLN cells from three mice per group were cultured with the indicated concentrations of KLH for 3 days. Cell proliferation was evaluated using the MTT assay. Cytokine concentrations were determined by ELISA. Data are presented as the mean ± standard deviation (n = 3) from one experiment representative of at least two independent experiments with similar results. *p < 0.05, **p < 0.01, and ***p < 0.001 indicate significant differences between the Fc-scTNFL-injected group and the control (PBS) group at the respective antigen concentrations (Tukey-Kramer test).
Figure 10
Figure 10
Quantification of antigen-specific CD4+ T cell responses mediated by Fc-scTNFL proteins using the AIM assay. The AIM assay was performed as described in Figure 8 . dLN cells, as in Figure 9 , were cultured in the absence (-) or presence (+) of 5 µg/mL KLH (+) for 18 hours. Data are presented as the mean ± standard deviation (n = 3) from one experiment representative of at least two independent experiments with similar results. *p < 0.05, **p < 0.01, and ***p < 0.001 indicate statistically significant differences among the groups (Tukey-Kramer test).

Similar articles

References

    1. So T, Ishii N. The TNF-TNFR family of co-signal molecules. Adv Exp Med Biol. (2019) 1189:53–84. doi: 10.1007/978-981-32-9717-3_3 - DOI - PubMed
    1. Croft M, So T, Duan W, Soroosh P. The significance of OX40 and OX40L to T-cell biology and immune disease. Immunol Rev. (2009) 229:173–91. doi: 10.1111/j.1600-065X.2009.00766.x - DOI - PMC - PubMed
    1. Ishii N, Takahashi T, Soroosh P, Sugamura K. OX40-OX40 ligand interaction in T-cell-mediated immunity and immunopathology. Adv Immunol. (2010) 105:63–98. doi: 10.1016/S0065-2776(10)05003-0 - DOI - PubMed
    1. So T, Lee SW, Croft M. Immune regulation and control of regulatory T cells by OX40 and 4-1BB. Cytokine Growth Factor Rev. (2008) 19:253–62. doi: 10.1016/j.cytogfr.2008.04.003 - DOI - PMC - PubMed
    1. Sugamura K, Ishii N, Weinberg AD. Therapeutic targeting of the effector T-cell co-stimulatory molecule OX40. Nat Rev Immunol. (2004) 4:420–31. doi: 10.1038/nri1371 - DOI - PubMed

LinkOut - more resources