. 2024 Dec 10;28(1):111563.
doi: 10.1016/j.isci.2024.111563. eCollection 2025 Jan 17.

IFN-γ licenses normal and pathogenic ALPK1/TIFA pathway in human monocytes

Affiliations

IFN-γ licenses normal and pathogenic ALPK1/TIFA pathway in human monocytes

Amandine Martin et al. iScience. .

Abstract

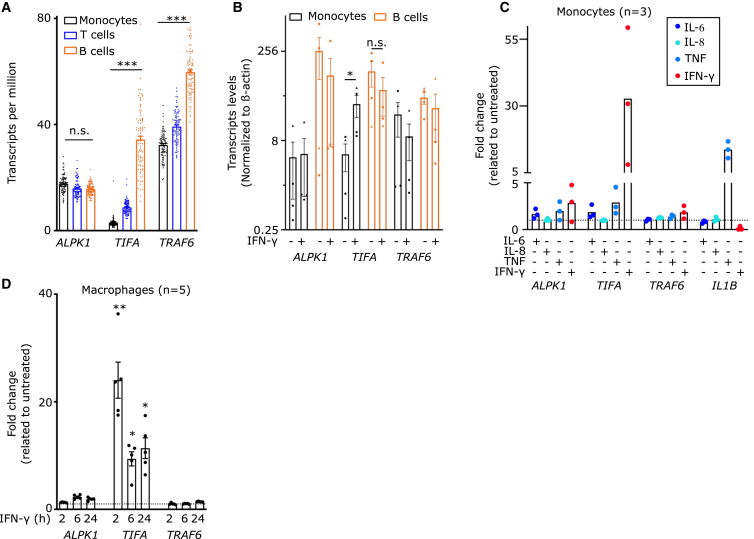
Alpha-kinase 1 (ALPK1) is an immune receptor sensing the bacterial nucleotide sugar ADP-heptose. ALPK1 phosphorylates TIFA leading to its oligomerization and downstream NF-κB activation. Specific mutations in ALPK1 are associated with an autoinflammatory syndrome termed ROSAH and with spiradenoma (skin cancers with sweat gland differentiation). This study investigated ALPK1 responses in human mononuclear cells and demonstrates that human mononuclear cells have distinct abilities to respond to ADP-heptose. Notably, IFN-γ is required to license the ALPK1/TIFA pathway in monocytes, while it was dispensable for the responsiveness of B cells. IFN-γ induced TIFA upregulation in monocytes, and TIFA induction was sufficient to recapitulate the licensing effect of IFN-γ. IFN-γ treatment promoted the phenotypic expression of pathogenic ALPK1 mutations. The licensing effect of IFN-γ in monocytes was blocked by JAK inhibitors. These findings underscore the critical role of IFN-γ in ALPK1 function and suggest JAK inhibitors as potential therapies for ALPK1-related inflammatory conditions.

Keywords: Biological sciences; Immunology; Natural sciences.


Conflict of interest statement

T.H. team obtained a research contract with financial support from Drug Farm, a company that develops agonists and inhibitors of ALPK1. Y.J. received consultant fees from Drug Farm. Other authors did not report any conflict of interest related to the present work.

Figures

None
Graphical abstract
Figure 1
Figure 1
IFN-γ is required to license ADP-heptose responsiveness in monocytes while it is dispensable in B cells (A–D) PBMCs from 3 healthy donors (HD) were primed or not with IFN-γ for 16 h followed by 30 min stimulation with ADP-heptose (ADPH) at 10 μM. (B) When applicable, cells were pretreated with ALPK1 inhibitor (IN-2) at 10 μM, 30 min before addition of ADPH. IκBα (left panel), NF-κB p65 phosphoserine 529 (middle panel) and, NF-κB p65 phosphoserine 536 (right panel) were detected by flow cytometry following gating on (A-B) CD3ε HLA-DR+ CD20+ cells (B cells), (C) CD20 CD3ε+ cells (T cells) and (D) CD20 CD3ε+ HLA-DR+ cells (monocytes). (E–G) CD14 cells from 4 healthy donors were primed or not with IFN-γ for 16 h followed by 6 h stimulation with ADP-heptose (ADPH) at 1 μM. CD69 was detected by flow cytometry following gating on CD3ε CD19+ cells (B cells, left panel) and, CD19 CD3ε+ cells (T cells, right panel). (F) CD69 mean fluorescence intensity (MFI) is quantified (a.u., arbitrary units). (G) The percentage of CD69+ cells is shown. (H) Primary monocytes from HD (open circle, n = 9) or ROSAH syndrome patients (red square, n = 1–2) were primed or not with IFN-γ (1000 u/mL) for 16 h, and then treated by ADP-heptose (1 μM) for 6 h. IL-8, CCL3, and TNF were quantified in the supernatant by ELISA. (A–E) Concatenates from three healthy donors are shown. (F and G) One dot corresponds to the value from one healthy donor, the bar corresponds to the mean of 4 healthy donors. One Way ANOVA with Holm-Sidak correction was performed (F: ∗∗: p = 0.0032, F: ∗∗∗p < 0.001; ∗ (from left to right) p = 0.023, p = 0.017). (H) Friedman paired test with Dunn’s correction for multiple tests was performed (n.s.: p = 0.4954; ∗∗∗: p < 0.001). Each symbol represents the average value from a biological triplicate from one individual, the red line shows the median and the dotted lines the quartile.
Figure 2
Figure 2
TIFA is differentially expressed at steady state in B cells and monocytes and strongly induced in the latter cells by IFN-γ (A) ALPK1, TIFA and TRAF6 transcript levels in monocytes (black), T cells (blue) or B cells (orange) were obtained from the public RNA-seq dataset DICE. (B) Transcript level of the indicated gene was determined by qRT-PCR in primary human monocytes (black) or B cells (orange) treated or not for 16 h with IFN-γ and normalized to β-actin levels. (D) Primary monocytes-derived macrophages from 5 healthy donors were treated with IFN-γ for the indicated time. ALPK1, TIFA and TRAF6 transcript levels were analyzed by RNA-seq and normalized to the untreated sample. (C) Transcript level of the indicated gene was determined by qRT-PCR in primary human monocytes treated for 16 h with IL-6 (100 ng/mL), IL-8 (100 ng/mL), TNF (100 ng/mL) or IFN-γ (1000 u/mL), normalized to β-actin levels and to the untreated sample. (A) Kruskal-Wallis unpaired test with Dunn’s correction for multiple tests was performed (n.s.: p = 0.22; ∗∗∗: p < 0.001). Each dot represents the value from one healthy donor, the bar represents the mean ± SEM. (B) Each dot and triangle represent the average value from a technical duplicate from one healthy donor (n = 3) or one ROSAH syndrome patient (n = 1), respectively. The bar represents the mean ± SEM. Friedman paired test with Dunn’s correction for multiple tests was performed (∗: p = 0.037, n.s.: p > 0.99). (C) Each dot represents the average value from a technical triplicate from one healthy donor (n = 3). The bar represents the mean. (C and D) The dotted horizontal line (y = 1) indicates an absence of change in transcript levels compared to untreated. (D) Each dot represents the value from one individual, the bar represents the mean ± SEM. Friedman paired test with Dunn’s correction for multiple tests was performed (∗∗: p = 0.006, ∗: p = 0.04, p = 0.03 from left to right, respectively).
Figure 3
Figure 3
IFN-γ induces TIFA expression to license ADP-heptose responsiveness in monocytes (A) U937 WT (black), ALPK1KO (blue) or TIFAKO (orange) were primed with IFN-γ and stimulated for 6 h with ADP-heptose (ADP-H) at the indicated concentration. IL-8 in the supernatant was quantified at 6 h post-treatment. (B and C) U937 cells expressing eGFP under the control of an NF-κB responsive promoter were primed or not with IFN-γ and treated with ADP-heptose (100 nM) for 6 h. GFP intensity was measured by flow cytometry. Histograms are shown in (B) and mean fluorescence intensity (MFI) is shown in (C). (D) U937 WT (black), ALPK1KO (blue), ALPK1 KO complemented with ALPK1 under the control of a doxycycline-inducible promoter (ALPK1KO iALPK1 (purple)), TIFAKO (orange) or TIFAKO complemented with TIFA under the control of a doxycycline inducible promoter (TIFAKO iTIFA (red)) were treated with doxycycline, primed or not with IFN-γ and stimulated for 6 h with ADP-heptose (ADP-H) at the indicated concentration. IL-8 in the supernatant was quantified at 6 h post-treatment. (E) U937 WT, ALPK1 KO complemented with ALPK1 under the control of a doxycycline-inducible promoter (ALPK1KO iALPK1), TIFAKO complemented with TIFA under the control of a doxycycline inducible promoter (TIFAKO iTIFA) were treated as indicated with doxycycline, primed or not with IFN-γ and stimulated for 30 min with ADP-heptose (ADP-H) at 1 μM and analyzed by western blot. ∗ indicates 3X-Flag TIFA while ∗∗indicates endogenous TIFA protein. (A) Each dot represents one biological replicate; the bar represents the mean ± SEM from three replicates. One experiment representative of three independent experiments is shown. One-way Anova with Sidak’s correction for multiple tests was performed ∗: p = 0.012, ∗∗∗: p < 0.001. (C and D) a.u. arbitrary units. One-way ANOVA with Sidak’s correction for multiple tests was performed. ∗∗∗: p < 0.001. Each dot represents one biological replicate, the bar represents the mean ± SEM from three replicates. One experiment representative of three independent experiments is shown. (D) One-way ANOVA with Sidak’s correction for multiple tests was performed to compare to IL-8 values obtained in WT U937 treated with ADP-heptose in the absence of IFN-γ. n.s.: 1.00, ∗∗∗: p < 0.001.
Figure 4
Figure 4
IFN-γ triggers ALPK1 pathogenic variants phenotype expression in monocytes (A and B) 293T were transfected with the plasmid encoding the indicated doxycycline-inducible ALPK1 variants or PSTPIP1 as a control (−) together with a plasmid encoding the firefly-luciferase under the control of an NF-κB-responsive promoter and a plasmid encoding the renilla-luciferase under a constitutive promoter. Cells were exposed or not to doxycycline for 16 h before measurement of luciferase. Firefly luciferase signal was normalized to renilla luciferase signal to obtain NF-κB activity. NF-κB activity in the absence of doxycycline was normalized to 100% for each cell line. (B) Doxycycline-induced cells were treated or not with ADP-heptose (1 μM) for 3 h before measurement of luciferase signals. (C and D) U937 monocytes WT, ALPK1KO or ALPK1KO complemented with the indicated doxycycline-inducible ALPK1 variants were treated with doxycycline, IFN-γ for 16 h and (D) ADP-heptose at 1 μM for 6 h. IL-8 release in the supernatant was quantified by ELISA. (A-D) Each dot represents one biological replicate, the bar represents the mean ± SEM from three replicates. One experiment representative of three independent experiments is shown. (A) One-way ANOVA with Sidak’s correction for multiple tests was performed to compare the normalized NF-κB activity obtained with the indicated variant to the one obtained in cells transfected with WT ALPK1. ∗∗∗: p < 0.001. Dotted lines indicate the 100% level and the normalized NF-κB activity obtained upon WT ALPK1 expression. (B) Kruskal-Wallis test with Dunn’s correction for multiple tests was performed to compare the normalized NF-κB activity obtained with the indicated ALPK1 variant upon ADP-heptose treatment to the one obtained in cells transfected with WT ALPK1 and treated with ADP-heptose. ∗: p = 0.027. Dotted lines indicate the normalized NF-κB activity obtained upon ADP-heptose in the absence (endogenous ALPK1 expression) and presence of WT ALPK1 transfection. (C and D) One-way ANOVA with Sidak’s correction for multiple tests was performed. (C) ∗∗: p = 0.0013, ∗∗∗: p < 0.001. (D) ∗∗∗: p < 0.001; ∗∗: p = 0.0015; p = 0.0022 from left to right, respectively; ∗: p = 0.012.
Figure 5
Figure 5
JAK inhibitors block IFN-γ-mediated ALPK1 responses (A) STAT1 Chip-seq data (GSE 43036) from primary human monocytes from one healthy donor treated or not with IFN- γ (100 u/mL) for 24 h and/or when indicated LPS (500 ng/mL) for 3 h were analyzed on the TIFA/ALPK1 genomic region using ChIP-Atlas and integrative Genomics Viewer. The raw CHIP-seq and the peak-call data (q < 1E-05) are shown for each sample. MACS2 score is indicated under each detected peak. (B) ALPK1, and TIFA transcript levels in U937 cells treated as indicated with IFN- γ (100 u/mL) for 16 h in the presence or not of Ruxolitinib (Ruxo.) at 1 μM. (C and D) U937 expressing eGFP under the control of an NF-κB-responsive promoter were treated with IFN- γ (1,000 u/mL) for 16 h in the presence or not of Ruxolitinib (Ruxo.) at 1 μM followed by ADP-heptose (100 nM) treatment for 6 h. (C) flow cytometry histograms corresponding to a concatenate of three independent samples are shown. (D) Quantification of the mean fluorescence intensity (MFI) is shown. (E) U937 cells were treated with IFN- γ (1,000 u/mL) for 16 h in the presence of the indicated JAK inhibitor at the indicated concentrations. Cells were treated with ADP-heptose (1 μM) for 3 h and IL-8 concentration in the supernatant was quantified by ELISA. Results were normalized to IL-8 concentrations obtained in U937 treated with IFN- γ and ADP-heptose in the absence of JAK inhibitors. (F) Primary monocytes from HD (open circle, n = 9) or ROSAH syndrome patients (red square, n = 2) were primed or not with IFN-γ (1000 u/mL) for 16 h in the presence of Ruxolitinib (1 μM) as indicated, and then treated by ADP-heptose (1 μM) for 6 h. IL-8 was quantified in the supernatant by ELISA. (B, D, and E) Each dot represents the value from one sample, the bar represents the mean ± SEM. (B, D) One-way ANOVA with Sidak’s correction for multiple tests was performed. ∗∗∗: p < 0.001; ∗∗: p = 0.0047; n.s.: not statistically significant. (B–E) One experiment representative of 2 independent experiments is shown. (F) Friedman paired test with Dunn’s correction for multiple tests was performed (∗∗∗: p < 0.001, n.s.:>0.99; n.s. = 0.056, from left to right). Each symbol represents the average value from a biological triplicate from one individual, the red line shows the median and the dotted lines the quartile.

References

    1. Zhou P., She Y., Dong N., Li P., He H., Borio A., Wu Q., Lu S., Ding X., Cao Y., et al. Alpha-kinase 1 is a cytosolic innate immune receptor for bacterial ADP-heptose. Nature. 2018;561:122–126. doi: 10.1038/s41586-018-0433-3. - DOI - PubMed
    1. García-Weber D., Dangeard A.-S., Cornil J., Thai L., Rytter H., Zamyatina A., Mulard L.A., Arrieumerlou C. ADP-heptose is a newly identified pathogen-associated molecular pattern of Shigella flexneri. EMBO Rep. 2018;19:e46943. doi: 10.15252/embr.201846943. - DOI - PMC - PubMed
    1. García-Weber D., Arrieumerlou C. ADP-heptose: a bacterial PAMP detected by the host sensor ALPK1. Cell. Mol. Life Sci. 2021;78:17–29. doi: 10.1007/s00018-020-03577-w. - DOI - PMC - PubMed
    1. Mattioli I., Sebald A., Bucher C., Charles R.-P., Nakano H., Doi T., Kracht M., Schmitz M.L. Transient and Selective NF-κB p65 Serine 536 Phosphorylation Induced by T Cell Costimulation Is Mediated by IκB Kinase β and Controls the Kinetics of p65 Nuclear Import 1. J. Immunol. 2004;172:6336–6344. doi: 10.4049/jimmunol.172.10.6336. - DOI - PubMed
    1. Wang D., Baldwin A.S., Jr. Activation of nuclear factor-kappaB-dependent transcription by tumor necrosis factor-alpha is mediated through phosphorylation of RelA/p65 on serine 529. J. Biol. Chem. 1998;273:29411–29416. doi: 10.1074/jbc.273.45.29411. - DOI - PubMed

LinkOut - more resources