. 2024 Dec 24;28(1):111680.
doi: 10.1016/j.isci.2024.111680. eCollection 2025 Jan 17.

Placode and neural crest origins of congenital deafness in mouse models of Waardenburg-Shah syndrome

Affiliations

Placode and neural crest origins of congenital deafness in mouse models of Waardenburg-Shah syndrome

Jaime Tan et al. iScience. .

Erratum in

Abstract

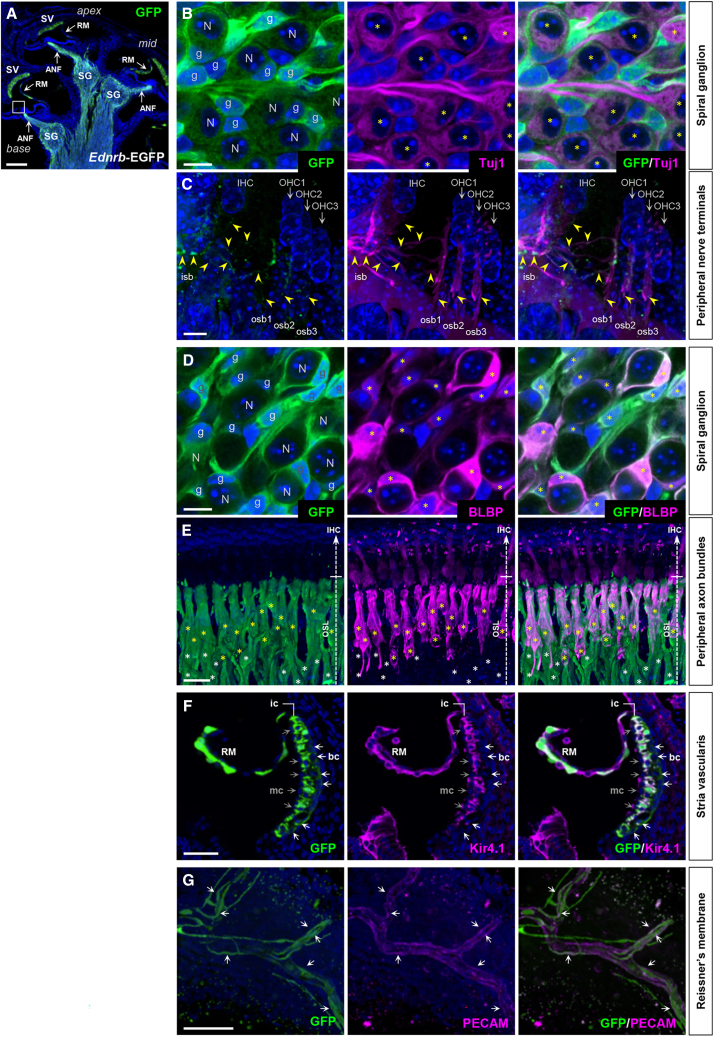
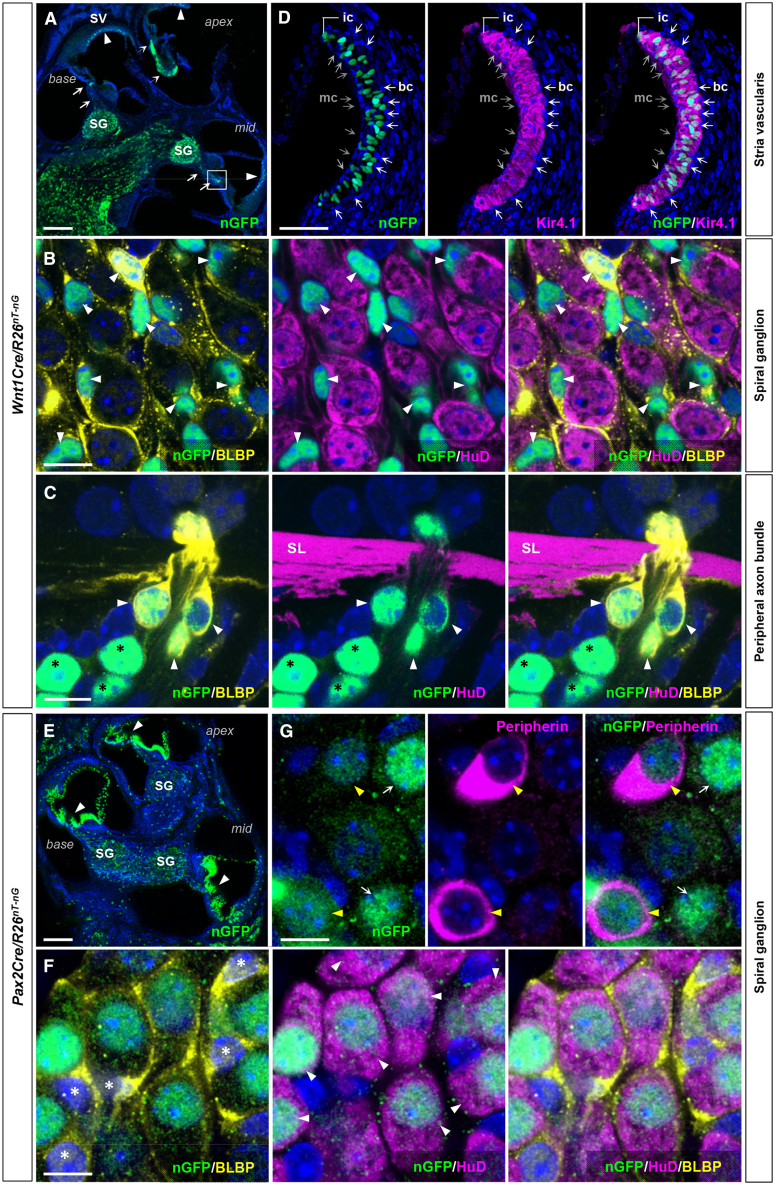
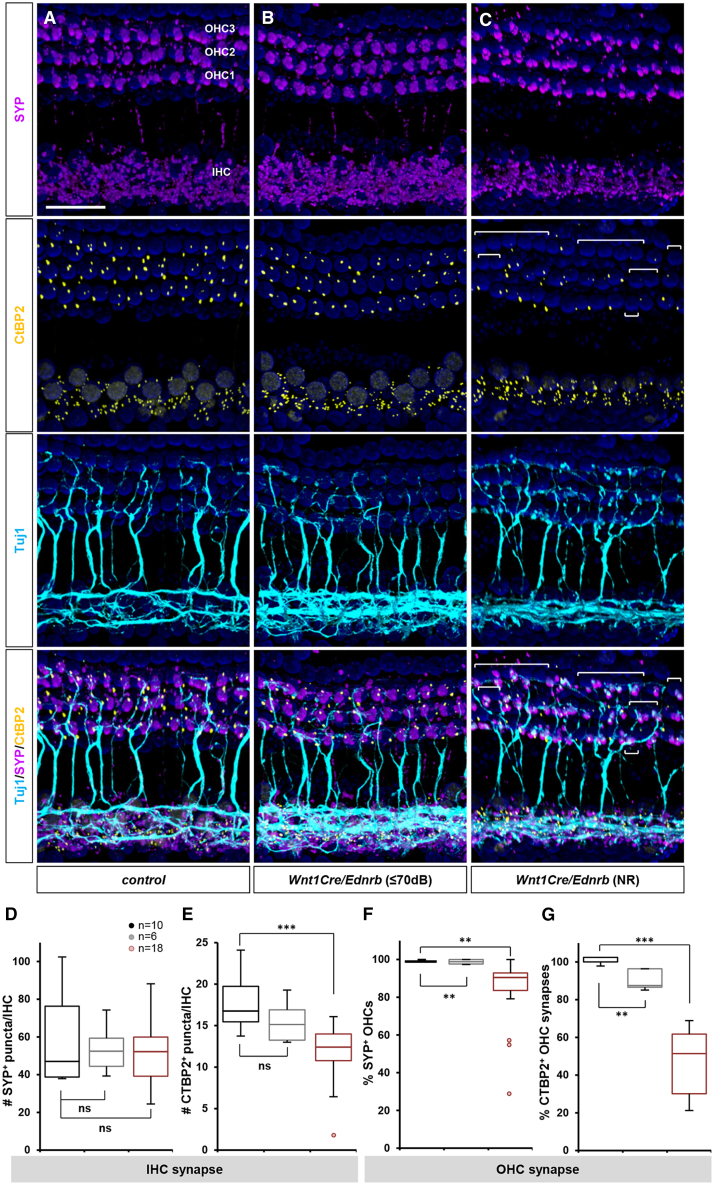
Mutations in the human genes encoding the endothelin ligand-receptor pair EDN3 and EDNRB cause Waardenburg-Shah syndrome (WS4), which includes congenital hearing impairment. The current explanation for auditory dysfunction is defective migration of neural crest-derived melanocytes to the inner ear. We explored the role of endothelin signaling in auditory development in mice using neural crest-specific and placode-specific Ednrb mutation plus related genetic resources. On an outbred strain background, we find a normal representation of melanocytes in hearing-impaired mutant mice. Instead, our results in neural crest-specific Ednrb mutants implicate a previously unrecognized role for glial support of synapse assembly between auditory neurons and cochlear hair cells. Placode-specific Ednrb mutation also caused impaired hearing, resulting from deficient synaptic transmission. Our observations demonstrate the significant influence of genetic modifiers in auditory development, and invoke independent and separable roles for endothelin signaling in the neural crest and placode lineages to create a functional auditory circuitry.

Keywords: Cellular neuroscience; Molecular neuroscience; Sensory neuroscience.


Conflict of interest statement

The authors declare no competing interests.

Figures

None
Graphical abstract
Figure 1
Figure 1
Incomplete penetrance of hearing impairment in Edn3-Ednrb signaling deficient mice (A) Compiled representation of the percentage of mice of each genotype that exhibited the indicated ABR threshold. Black bars, genetic controls (see also Table S1); dark gray bars, hearing mutants; light gray bars, hearing impaired mutants (ABR threshold 80-90dB); white bars, non-hearing mutants (NR = no response at the highest stimulus intensity (90dB)). (B) Table summarizing the number of animals tested and phenotype frequency for global Ednrb, global Edn3, Wnt1Cre/Ednrb and Pax2Cre/Ednrb mutant mice. (C) Mean DPOAEs (±SEM) from controls (n = 26) and a subset of hearing impaired (ABR threshold≥80dB) Ednrb (n = 8), Edn3 (n = 15), Wnt1Cre/Ednrb (n = 15) and Pax2Cre/Ednrb (n = 13) mutants at L1 intensity level (dB SPL) of the indicated frequency (kHz). L1 is the stimulus level of the first (f1) primary tone (see STAR Methods). (D) Mean amplitude vs. latency plots for wave I in ABR waveforms at 90dB (left) and 80dB (right) acquired from hearing mutants (ABR threshold≤70dB, dark gray); hearing impaired mutants (left, ABR threshold 80dB and 90dB, light gray; right, ABR threshold = 80dB, light gray) and their littermate controls (black). Error bars; ±SEM. p-values; ∗p < 0.05, ∗∗p < 0.01, ∗∗∗p < 0.001, ns = not significant; t-test.
Figure 2
Figure 2
Ednrb expression in P7 cochlea (A–G) Sagittal sections of cochlea isolated from P7 Ednrb-EGFP BAC transgenic mice stained for GFP only (green; A) or co-stained for neuronal Tuj1 (magenta; B and C), glial BLBP (magenta; D and E), inward rectifier potassium channel Kir4.1 (magenta; F), and vascular endothelial PECAM (magenta; G), and counterstained with DAPI (blue). High magnification views demonstrate Ednrb expression in SGN cell bodies (B) and peripheral nerve terminals (C), in satellite glia in the spiral ganglia (D) and peripheral axon bundles (E), in Kir4.1+ intermediate and Kir4.1- basal stria cells (F), and in vascular endothelial cells of the Reissner’s membrane (G, flat mount view). “N” and “g” in (B) and (D) denote spiral ganglion neurons and glia, respectively. Yellow asterisks in (B) denote GFP+; Tuj1+ spiral ganglion neurons. Yellow arrowheads in (C) point to GFP+; Tuj1+ axons of spiral ganglion neurons that innervate the inner and outer hair cells corresponding to the boxed area in (A). GFP signal is much stronger in glia than in neurons. Yellow asterisks in (D) denote GFP+; BLBP+ satellite glia in the spiral ganglion. Among all Schwann cells that are associated with auditory nerve axonal bundles in (E), GFP+; BLBP+ cells and GFP+; BLBP- cells are denoted by yellow and white asterisks, respectively. White and gray arrows in (F) point to GFP+; Kir4.1- basal stria cells and GFP-; Kir4.1- marginal stria cells, respectively. Arrows in (G) denote GFP+; PECAM+ vascular endothelial cells of the Reissner’s membrane. Abbreviations: ANF, auditory nerve fibers; bc, basal cell; ic, intermediate cell; IHC, inner hair cell; isb, inner spiral bundle; mc, marginal cell; OHC, outer hair cell; osb, outer spiral bundle; OSL, osseous spiral lamina; RM, Reissner’s membrane; SG, spiral ganglion; SV, stria vascularis. Scale bars: 200μm (A), 10μm (B–D), 25μm (E), 100μm (F), 50μm (G).
Figure 3
Figure 3
Wnt1Cre and Pax2Cre delineate distinct cell types in the cochlea (A–G) Sagittal sections of cochlea isolated from P7 Wnt1Cre/R26nT-nG (A–D) and Pax2Cre/R26nT-nG (E–G) mice stained for GFP (A), costained for neuronal HuD (B, C, and F), glial BLBP (B, C, and F), Kir4.1 (D), type II neuron-specific Peripherin (G), and counterstained with DAPI (blue). (A) Reporter recombination (nuclear GFP) driven by Wnt1Cre occurs in the stria vascularis (arrowheads), and in the spiral ganglion and along their peripheral nerve trajectories (arrows). (B) High magnification view of spiral ganglia in (A) shows Wnt1Cre is active in BLBP+ satellite cells (arrowheads) but not in HuD+ SGNs. (C) A magnified view of the boxed area in (A). Wnt1Cre labels BLBP+ (arrowheads) and BLBP- (black asterisks) Schwann cells (HuD-) along the peripheral nerve bundles. (D) A magnified view of the stria vascularis in (A) shows the activity of Wnt1Cre in Kir4.1+ intermediate stria cells, but not in Kir4.1- basal (white arrows) and medial (gray arrows) stria cells. (E) Reporter recombination by Pax2Cre occurs in vast majority of cochlear epithelium (arrowheads) and in the spiral ganglion. (F and G) High magnification views of spiral ganglia in (E) demonstrate that Pax2Cre is exclusively active in HuD+ SGNs (F; white arrows) including Peripherin+ type II neurons (G; yellow arrows) but not in BLBP+ satellite cells (F; asterisks). Abbreviations: SL, spiral lamina. Scale bars; 200μm (A, E), 10μm (B and C, F and G), 100μm (D).
Figure 4
Figure 4
Contribution of Wnt1Cre-labeled melanocytes to the Kir4.1+ intermediate stria cells in hearing and hearing impaired Ednrb-deficient mice (A–G) Confocal (z stack) images of the stria vascularis of P19 hearing (ABR threshold≤70dB) Wnt1Cre/Ednrb/R26td-Tomato mutant (B and C), hearing impaired (ABR threshold = NR) Wnt1Cre/Ednrb/R26td-Tomato mutants (D and E), a littermate control (A), and hearing impaired (ABR threshold = NR) global Ednrb mutant crossed into the Wnt1Cre/R26td-Tomato background (F) immunostained for Kir4.1 (green) and counterstained with DAPI (blue). (C and E) Asterisks denote the portion of the stria vascularis that does not contain Wnt1Cre lineage derived Kir4.1+ intermediate cells. Arrows point out Wnt1Cre lineage+ cells that are lacking Kir4.1 expression. Arrowheads point out misexpression or mislocalization of Kir4.1 at the apical surface of the marginal stria cells. Scale bar: 100μm. (G) Table summarizing the number of animals tested and the phenotype (intermediate cell number and maturation) frequency for Wnt1Cre/Ednrb and global Ednrb mutant mice.
Figure 5
Figure 5
Defective synapse formation in hearing impaired Wnt1Cre/Ednrb mutant mice (A–G) Whole-mount preparations of cochlea isolated from P19 Wnt1Cre/Ednrb mutant mice (B and C) and a littermate control (A) immunostained for postsynaptic SYP (magenta), presynaptic CtBP2 (yellow), neuronal Tuj1 (cyan), and counterstained with DAPI (blue). The image shown in (C) is from a hearing impaired Wnt1Cre/Ednrb mutant of median synaptic phenotype. OHCs in the bracketed areas lack CtBP2+ synaptic ribbons. Scale bar: 50μm. (D and E) Box and whisker plots for the number of SYP+ (D) and CtBP2+ (E) puncta per IHC in control (black), hearing Wnt1Cre/Ednrb mutant (gray), and hearing impaired Wnt1Cre/Ednrb mutant (ABR threshold ≥80dB; red) mice. (F and G) Box and whisker plots for the percentage of OHCs with postsynaptic SYP+ staining (F) and presynaptic CtBP2+ staining (G) in control (black), hearing Wnt1Cre/Ednrb mutant (gray), and hearing impaired Wnt1Cre/Ednrb mutant (ABR threshold ≥80dB; red) mice. Extremely compromised outliers in (E-F) were plotted individually and not included in the statistical analysis. p-values: ∗∗p < 0.01, ∗∗∗p < 0.001, ns = not significant; t-test.
Figure 6
Figure 6
Defective SGN activation in hearing impaired Pax2Cre/Ednrb mutant mice (A–C) High magnification views of P19 spiral ganglion sections from hearing Pax2Cre/Ednrb (B), hearing impaired Pax2Cre/Ednrb (C) mutant mice and a littermate control (A) immunostained for SYP (green), and NF200 (magenta), and counterstained with DAPI (blue). Compiled representation of SYP+ area per SGN in each group is shown in D (see STAR Methods). (D) Box and whisker plots for the SYP+ area per SGN in control (black), hearing Pax2Cre/Ednrb mutant (gray) and hearing impaired mutant (ABR threshold = NR; red) mice. (E–G) Stacked confocal images of a single IHC acquired from sagittal sections of cochlea isolated from P19 hearing Pax2Cre/Ednrb (F), hearing impaired Pax2Cre/Ednrb (G) mutants and a littermate control (E) immunostained for GluR2 (yellow), and CtBP2 (magenta), and counterstained with DAPI (blue). Whole-mount views of cochlea from each given genotype immunolabeled for GluR2 and CtBP2 are shown in Figure S8. Arrowheads denote GluR2 puncta which are not juxtaposed with presynaptic CtBP2 puncta. Arrows point to CtBP2 puncta that are not juxtaposed with postsynaptic GluR2. Compiled representations of GluR2+ puncta number per IHC and GluR2/CtBP2 ratio per IHC are shown in H and I, respectively (see STAR Methods). (H and I) Box and whisker plots for the number of GluR2+ puncta per IHC (H) and the ratio of GluR2/CtBP2 puncta (I) in control (black), hearing Pax2Cre/Ednrb mutant (gray) and hearing impaired mutant (ABR threshold = NR; red) mice. Arrows in (H) and (I) represent hearing impaired Pax2Cre/Ednrb mutants exhibiting a normal GluR2 profile at the IHC synapse that were not included in the statistical analysis. p-values: ∗∗p < 0.01, ∗∗∗p < 0.001, ns = not significant; t-test. Scale bars: 10μm (A–C), 5μm (E–G).

References

    1. Barald K.F., Kelley M.W. From placode to polarization: new tunes in inner ear development. Development. 2004;131:4119–4130. doi: 10.1242/dev.01339. - DOI - PubMed
    1. Ladher R.K., O'Neill P., Begbie J. From shared lineage to distinct functions: the development of the inner ear and epibranchial placodes. Development. 2010;137:1777–1785. doi: 10.1242/dev.040055. - DOI - PubMed
    1. Zine A., Fritzsch B. Early Steps towards Hearing: Placodes and Sensory Development. Int. J. Mol. Sci. 2023;24 doi: 10.3390/ijms24086994. - DOI - PMC - PubMed
    1. Pyott S.J., Pavlinkova G., Yamoah E.N., Fritzsch B. Harmony in the Molecular Orchestra of Hearing: Developmental Mechanisms from the Ear to the Brain. Annu. Rev. Neurosci. 2024;47:1–20. doi: 10.1146/annurev-neuro-081423-093942. - DOI - PMC - PubMed
    1. Steel K.P., Barkway C. Another role for melanocytes: their importance for normal stria vascularis development in the mammalian inner ear. Development. 1989;107:453–463. doi: 10.1242/dev.107.3.453. - DOI - PubMed

LinkOut - more resources