[Preprint]. 2025 Jan 21:2025.01.16.633481.
doi: 10.1101/2025.01.16.633481.

The ratio of Wnt signaling activity to Sox2 transcription factor levels predicts neuromesodermal fate potential

Affiliations

The ratio of Wnt signaling activity to Sox2 transcription factor levels predicts neuromesodermal fate potential

Robert D Morabito et al. bioRxiv. .

Update in

Abstract

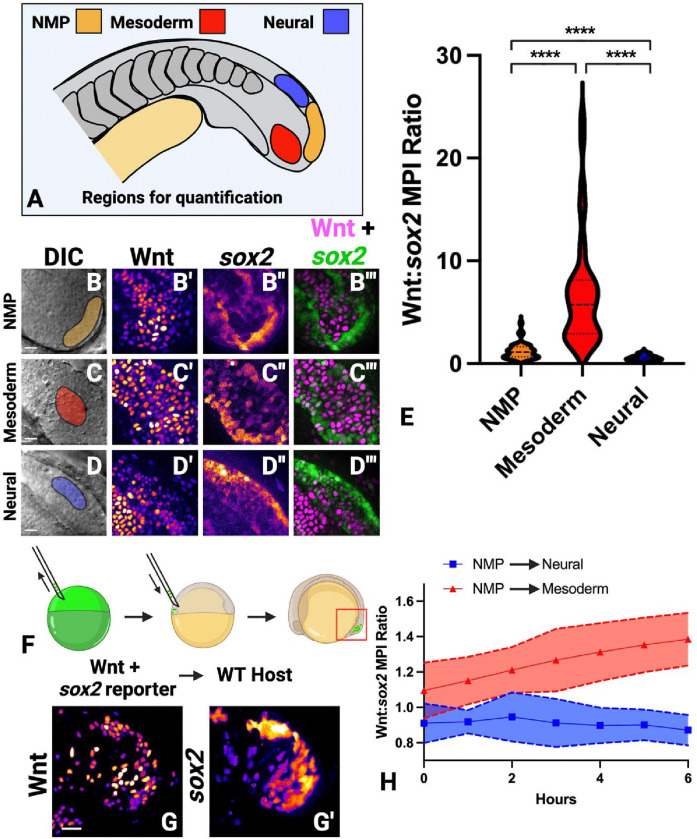
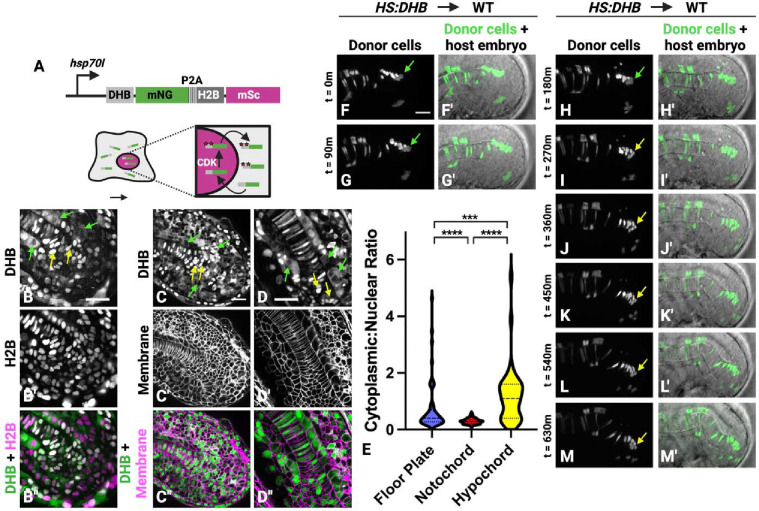
Neuromesodermal progenitors (NMPs) are a vertebrate cell type that contribute descendants to both the spinal cord and the mesoderm. The undifferentiated bipotential NMP state is maintained when both Wnt signaling is active and Sox2 is present. We used transgenic reporter lines to live-image both Wnt activity and Sox2 levels in NMPs and observed a unique cellular ratio in NMPs compared to NMP-derived mesoderm or neural tissue. We used this unique signature to identify the previously unknown anatomical position of a progenitor population that gives rise to the midline tissues of the floor plate of the spinal cord and the mesodermal notochord. Thus, quantification of the active Wnt signaling to Sox2 ratio can be used to predict and identify cells with neuromesodermal potential. We also developed the auxin inducible degron 2 system for use in zebrafish to test the temporal role that Sox2 plays during midline formation. We found ectopic Sox2 in the presence of Wnt activity holds cells in the undifferentiated floor plate/notochord progenitor state, and that degradation of the ectopic Sox2 is required for cells to adopt a notochord fate.

Keywords: Auxin inducible degron; Floor plate; Neuromesodermal progenitors; Notochord; Sox2; Wnt; single cell sequencing.


Figures

Figure 1 –
Figure 1 –. Neuromesodermal progenitors and their descendants have a unique Wnt signaling to Sox2 expression ratio.
(A) Embryos containing a single copy of both the 7xTCF-Xla.Siam:nlsmCherry (Wnt reporter) and sox2–2a-sfGFP (sox2 reporter) were imaged and mean pixel intensities were measured in the NMP, paraxial mesoderm, and neural tube regions of the tailbud (40 NMP, 41 paraxial mesoderm, 30 neural cells measured). (B-D”’) Representative images of the NMP (B-B”’), paraxial mesoderm (C-C”’), and neural tube (D-D”’) regions are shown. (E) Quantification of the mean pixel intensities were calculated as a ratio of Wnt reporter fluorescence divided by sox2 reporter fluorescence. The ratio in each region was significantly different than other regions (P<0.0001, unpaired t-test). (F) A cell transplantation method was used to target donor cells with both reporter transgenes into the NMP population of unlabeled wild-type host embryos. (G, G’) Time-lapse imaging was performed, with time-point 0 shown. (H) The mean pixel intensity ratio of Wnt reporter divided by the sox2 reporter was calculated over time in NMP cells that join the paraxial mesoderm or in NMP cells that join the neural tube, showing dynamic changes in the ratio over time (20 cells measured, 10 that become mesoderm, 10 that become neural). Scale bars = 20μm.
Figure 2 –
Figure 2 –. The Wnt:sox2 ratio identifies dorsal midline progenitors with neuromesodermal potential.
(A) Embryos containing a single copy of both the 7xTCF-Xla.Siam:nlsmCherry (Wnt reporter) and sox2–2a-sfGFP (sox2 reporter) were imaged and mean pixel intensities were measured in the posterior hypochord, notochord, and floor plate regions of the tailbud (42 notochord, 32 floor plate, 28 hypochord cells measured). (B-B”’) Representative images of the midline tissues are shown. (C) Quantification of the mean pixel intensities were calculated as a ratio of Wnt reporter fluorescence divided by sox2 reporter fluorescence. The ratio in each region was significantly different than other regions (P<0.0001, unpaired t-test). (D) The ratio between the floor plate and the NMPs was not statistically different. (E) A cell transplantation method was used to target labeled donor cells to the midline progenitors of unlabeled wild-type host embryos. (F-I’) Wild-type cells labeled with rhodamine dextran were transplanted into the midline progenitor population of unlabeled wild-type host embryos and time-lapse imaging was performed beginning at the 16-somite stage. (F) The border between the notochord and floor plate is indicated by a pink dashed line. Cells continuous with the posterior floor plate (white arrow, F’) move posteriorly relative to the notochord. Cells within this population contribute to both floor plate (I’, blue arrow) and notochord (I’, red arrow), with cells moving ventrally when forming the notochord (N=6 movies). (J-M’) Transgenic HS:CAAX-mCherry-2a-NLS-KikGR cells were transplanted into the midline progenitor domain of unlabeled wild-type host embryos and transgene expression was induced at bud stage. Time-lapse movies were made beginning at the 16-somite stage (J-M’, membranes are labeled in green and nuclei in magenta). Cells continuous with the posterior floor plate (white arrow, J’) move posteriorly relative to the notochord. Cells within this population contribute to floor plate and notochord (K-M’, red arrows show a notochord forming cell and blue arrows point to floor plate forming cells, N=4 movies). (N-P) Hybridization chain reaction was performed on embryos at the 16-somite stage using probes for the floor plate marker shhb and the notochord marker col2a1. At the posterior end of the floor plate the expression domain of shhb turns sharply into where the notochord progenitors reside (N, white arrow). Scale bars = 20μm.
Figure 3 -
Figure 3 -. scRNA-seq of the developing vertebrate tailbud identifies neuromesodermal progenitors and their derivatives.
(A) Schematic showing procedure for tailbud single cell isolation and sequencing. (B) UMAP embedding of 11,138 single cells sequenced from the tailbud. Cell types are labeled, and two markers for each cell type are included below labels. (C) Dotplot showing top 4 marker genes in each cell type by differential expression analysis. Colored boxes correspond to cell type. Greyscale indicates average expression and dot size indicates percent of expressing cells within each cell type. Marker genes were determined by Wilcoxon rank sum test. (D) UMAP embedding of all cells assigned a midline tissue identity in the full tailbud analysis. Unbiased clustering resulted in 5 distinct clusters. (E) Dotplot showing top 4 marker genes in each cell cluster shown in C by differential expression analysis. Colored boxes correspond to cell type. Greyscale indicates average expression and dot size indicates percent of expressing cells within each cell type. (F) UMAP overlay of gene scoring for cell-type specific markers.
Figure 4 –
Figure 4 –. Pseudotime and RNA velocity analysis details emergence of notochord and floor plate and identifies a molecular signature of midline progenitor cells.
(A) The UMAP embedding of all cells assigned a midline tissue identity is shown again as a reference. (B) UMAP embedding and trajectory computed in Monocle3. (C) Pseudotime values computed from differentiation trajectory with putative MPC population (cluster 1) as the starting node overlayed with Seurat UMAP. (D) Local regression for NMP markers sox2 and tbxta across the floor plate trajectory branch (cluster 1 to cluster 4) and notochord trajectory branch (cluster 1 to cluster 5). (E) UMAP overlayed with expression for both of the NMP markers sox2 and tbxta or (F) the NMP marker fgf8a and sox2. Overlapping expression is observed in cluster 1. (G) UMAP overlayed with expression of fgf8a and the notochord and midline progenitor marker noto. (H) RNA velocity analysis identifies cluster 1 as the putative MPC population. (I) UMAP colored by cell cycle states determined by cell cycle scoring. G1, S, and G2/M stages are not evenly distributed among clusters. (J) Dotplot showing top 15 marker genes in each cell-cycle state by differential expression analysis. Colored boxes correspond to cell type. Greyscale indicates average expression and dot size indicates percent of expressing cells within each cell type.
Figure 5 –
Figure 5 –. The dorsal midline NMPs are a proliferative cell population.
(A) A schematic shows the Cdk sensor transgenic construct used to assess cell cycle state in live cells. (B-B”’) The HS:DHB-mNG-p2a-H2B-mSc transgenic line at the 26-somite stage shows localization of the DHB Cdk sensor (B), nuclei (B’), and are overlayed in B”. Yellow arrows point to examples of G1 phase cells with nuclear DHB localization, and green arrows point to G2 phase cells with cytoplasmic DHB localization. (C-D”) The HS:DHB-mSc-p2a-H2B-miRFP670 was crossed to the plasma membrane reporter line ubb:lck-mNG and imaged at the 22-somite stage (C-C”) and at 24 hpf (D-D”). Again, yellow arrows point to examples of G1 phase cells with nuclear DHB localization, and green arrows point to G2 phase cells with cytoplasmic DHB localization. (E) Quantification of the cytoplasm:nuclear ratio of DHB at the 26-somite stage shows that notochord cells are in G1 while posterior floor plate and hypochord cells are cycling (118 notochord, 52 floor plate, 43 hypochord cells measured). (F-M’) Midline progenitor targeted transplantation and time-lapse imaging using HS:DHB-mSc-p2a-H2B-miRFP670 donor cells show that the dorsal midline NMPs are in various phases of the cell cycle but arrest in G1 before entering the notochord domain (F-M’). Green arrows show location of proliferative cells at the dorsal midline NMP migration front (F-H’), which divide and enter G1 (yellow arrows) followed by ventral migration into the notochord domain (J-M’). Scale bars = 20μm.
Figure 6 –
Figure 6 –. Changing the Wnt:sox2 ratio prevents the dorsal midline NMP to notochord transition.
(A-A”’) Transplanting wild-type rhodamine dextran labeled cells into the midline progenitor region of host embryos shows transplanted cells contributing to both the floor plate and notochord (red boxes in A and A” show regions in A’ and A”’, respectively N=7). (B-B”’) When the sox2 level is elevated in transplanted cells, using the HS:sox2 transgenic line, cells stay in the dorsal midline progenitor zone but fail to generate notochord (red boxes in B and B” show regions in B’ and B”’, respectively, N=11). Embryos were imaged at 24 hpf and sox2 was induced at bud stage. (C-F’) Time-lapse imaging of wild-type cells transplanted into the midline progenitor region of wild-type host embryos shows cells in the dorsal midline NMP region contributing to floor plate and notochord. (G-N’) However, when transgenic cells are transplanted into wild-type host embryos and sox2 is activated (using the HS:sox2 line) (G-J’) or Wnt signaling is inhibited (using the HS:tcfΔC line) (K-N’) at bud stage, cells remain at the migratory front of the dorsal midline NMP region but do not join the notochord (white arrows). Time-lapse imaging was started at the 12-somite stage and continued for 360 minutes. Scale bars = 20μm.
Figure 7 –
Figure 7 –. Sox2 maintains dorsal midline NMPs in a bipotential progenitor state.
(A-C) Hybridization chain reaction was performed on embryos at the 16-somite stage using probes for sox2 and the notochord marker col2a1. (D) The plasmid construct used to temporally induce expression of mNG-sox2-AID and mScarlet-H2B. (E-J) Plasmid injected embryos were heat-shocked at shield stage and timelapse imaged for 2 hours. In the absence of 5-Ph-IAA, mNG-Sox2-AID levels are maintained (E-G), as are mSc-H2B levels (H-J). (Q) Mean pixel intensity of mNG-Sox2-AID in the absence of 5-Ph-IAA are plotted at 10-minute intervals (N=30 cells). (K-P) In the presence of 5-Ph-IAA, mNG-Sox2-AID levels are rapidly depleted immediately after 5-Ph-IAA addition (K-M), whereas mScarlet-H2B levels are maintained (N-P). (R) Mean pixel intensities of mNG-Sox2-AID in the presence of 5-Ph-IAA are plotted at 10-minute intervals (N=31 cells). (S-V) Plasmid injected embryos were heat-shocked at shield stage and treated with or without 5-Ph-IAA beginning at bud stage. Embryos were imaged at the 16-somite stage. (S-T, AA, EE) In the absence of 5-Ph-IAA, mNG-Sox2-AID levels are maintained (EE, N=30 cells) and cells join the floor plate and hypochord but not the notochord (S-T, AA, N=35 cells). (U-V, BB, EE) In the presence of 5-Ph-IAA, mNG-Sox2-AID is depleted (EE, N=34 cells) and notochord contribution resumes (U-V, BB, N=36 cells, P<0.0001 chi square test). (W-Z) Plasmid injected embryos were used as donor embryos in midline directed transplants, and host embryos were heat-shocked at the shield stage and treated with or without 5-Ph-IAA beginning at bud stage. Embryos were imaged at the 16-somite stage. (W-X, CC, FF) In the absence of 5-Ph-IAA, mNG-Sox2-AID levels are maintained (FF, N=44 cells) and cells join the floor plate and hypochord but not the notochord (W-X, CC, N=36 cells). (Y-Z, DD, FF) In the presence of 5-Ph-IAA, mNG-sox2-AID is depleted (FF, N=45 cells) and notochord contribution resumes (Y-Z, DD, N=41 cells, P<0.0001 chi square test). Scale bars = 20μm.
Figure 8 –
Figure 8 –. Model of zebrafish midline development.
(A) The midline cells of a zebrafish embryo are schematized showing the location of cells (purple) with an NMP specific Wnt/Sox2 ratio. (B) These cells represent the dorsal midline NMPs (purple) that generate floor plate (blue) and notochord (red). Ventral mesendodermal progenitors (MEPs, orange) give rise to hypochord (yellow) and notochord (red). Red arrows show the movement of cells during tissue formation. NMPs and MEPs migrate posteriorly with some cells at the posterior-most domains converging and extending to form notochord, while cells in the trailing region slow their migration and form floor plate or hypochord, respectively. (C) Midline cells that are actively proliferating based on a Cdk activity reporter are highlighted in green.

References

    1. Adikes R.C., Kohrman A.Q., Martinez M.A.Q., Palmisano N.J., Smith J.J., Medwig-Kinney T.N., Min M., Sallee M.D., Ahmed O.B., Kim N., Liu S., Morabito R.D., Weeks N., Zhao Q., Zhang W., Feldman J.L., Barkoulas M., Pani A.M., Spencer S.L., Martin B.L., Matus D.Q., 2020. Visualizing the metazoan proliferation-quiescence decision in vivo. Elife 9 ( 10.7554/eLife.63265). - DOI - PMC - PubMed
    1. Amacher S.L., Kimmel C.B., 1998. Promoting notochord fate and repressing muscle development in zebrafish axial mesoderm. Development 125, 1397–1406. - PubMed
    1. Avilion A.A., Nicolis S.K., Pevny L.H., Perez L., Vivian N., Lovell-Badge R., 2003. Multipotent cell lineages in early mouse development depend on SOX2 function. Genes Dev 17, 126–140 ( 10.1101/gad.224503). - DOI - PMC - PubMed
    1. Barske L., Askary A., Zuniga E., Balczerski B., Bump P., Nichols J.T., Crump J.G., 2016. Competition between Jagged-Notch and Endothelin1 Signaling Selectively Restricts Cartilage Formation in the Zebrafish Upper Face. PLoS Genet 12, e1005967 ( 10.1371/journal.pgen.1005967). - DOI - PMC - PubMed
    1. Bergsland M., Ramskold D., Zaouter C., Klum S., Sandberg R., Muhr J., 2011. Sequentially acting Sox transcription factors in neural lineage development. Genes Dev 25, 2453–2464 ( 10.1101/gad.176008.111). - DOI - PMC - PubMed

Publication types

LinkOut - more resources