[Preprint]. 2025 May 9:2025.01.13.632851.
doi: 10.1101/2025.01.13.632851.

Conservation of symmetry breaking at the level of chromatin accessibility between fly species with unrelated anterior determinants

Affiliations

Conservation of symmetry breaking at the level of chromatin accessibility between fly species with unrelated anterior determinants

Ezra E Amiri et al. bioRxiv. .

Abstract

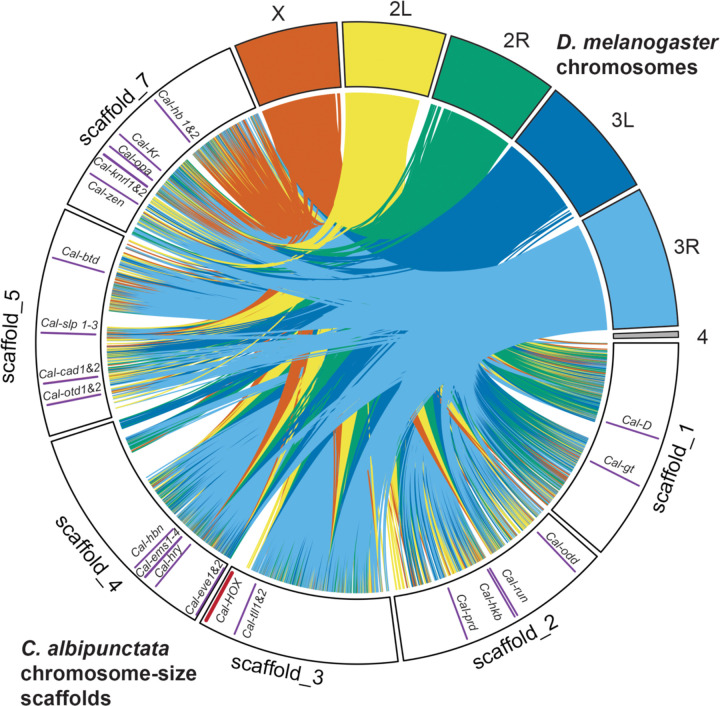
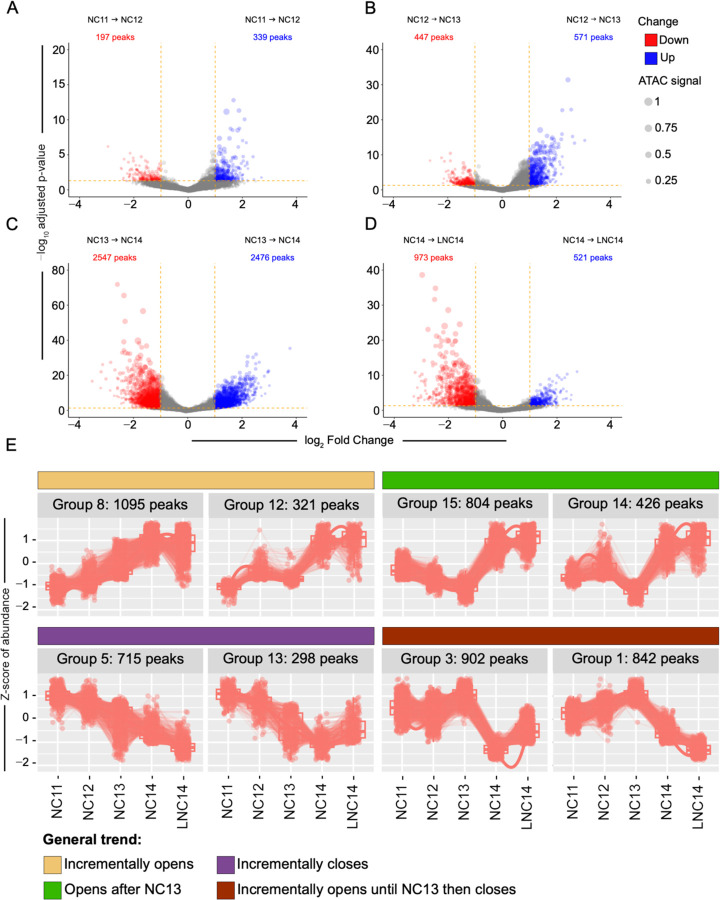
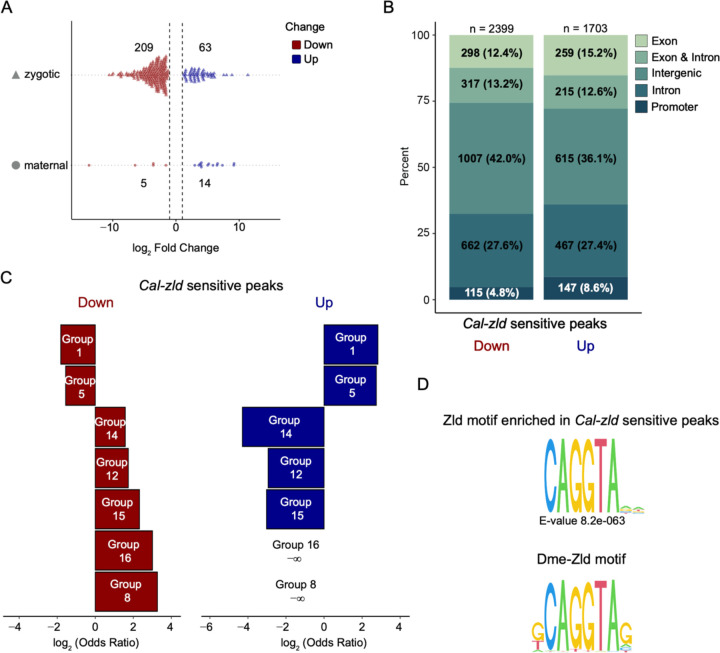
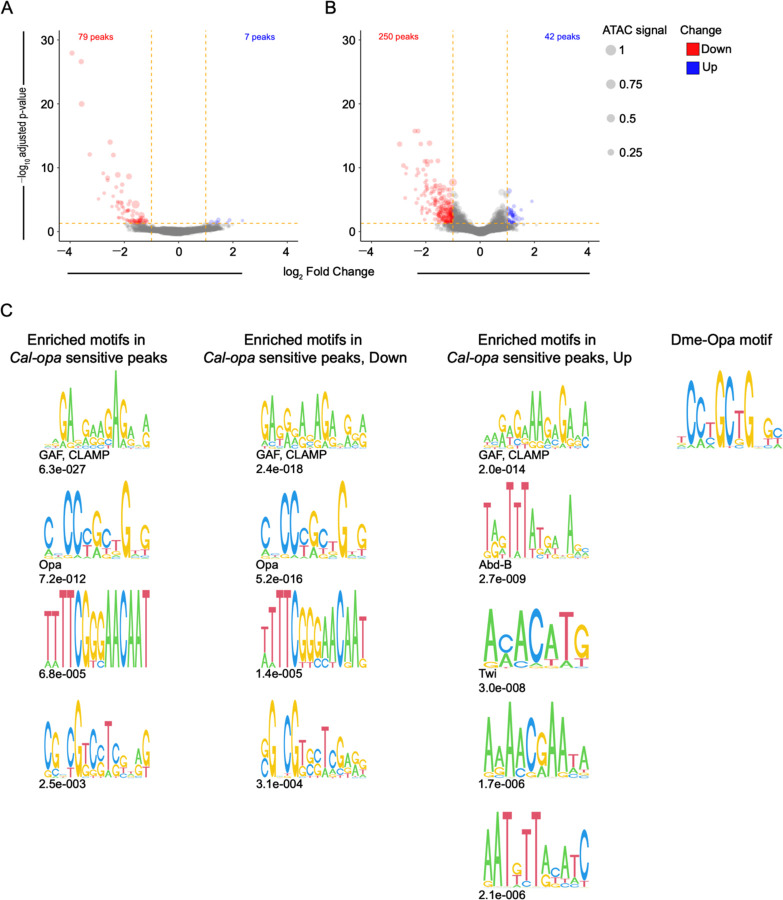
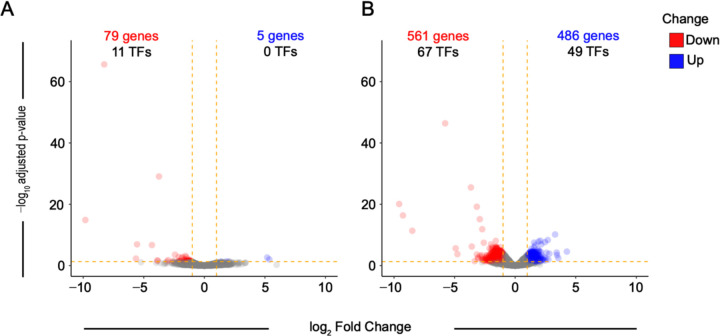
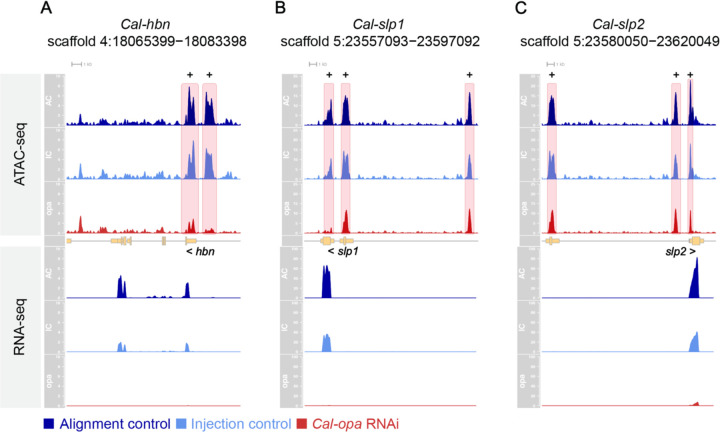
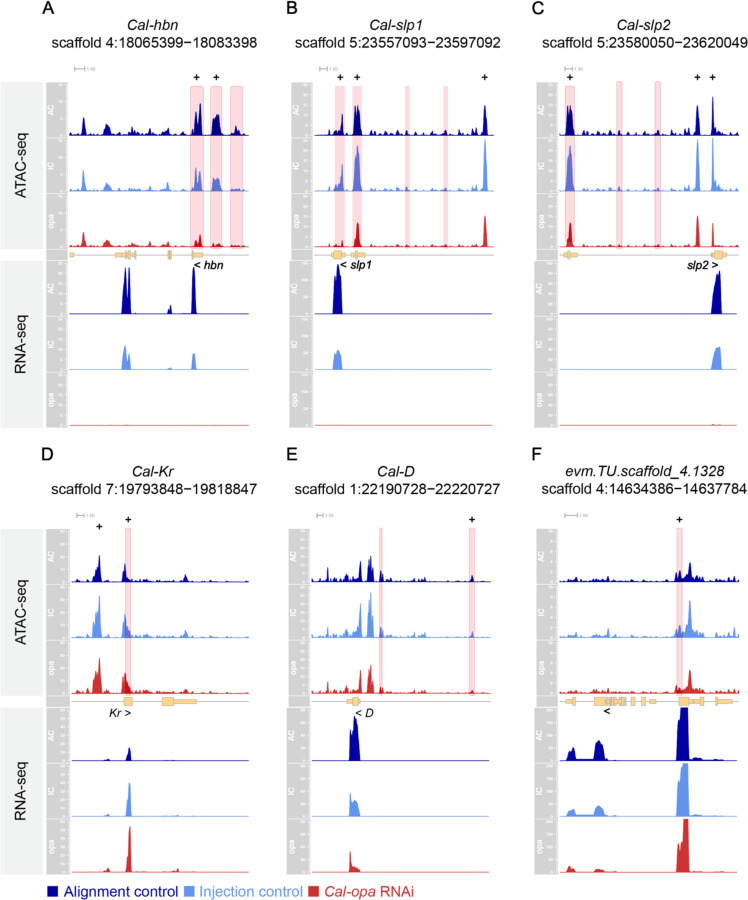
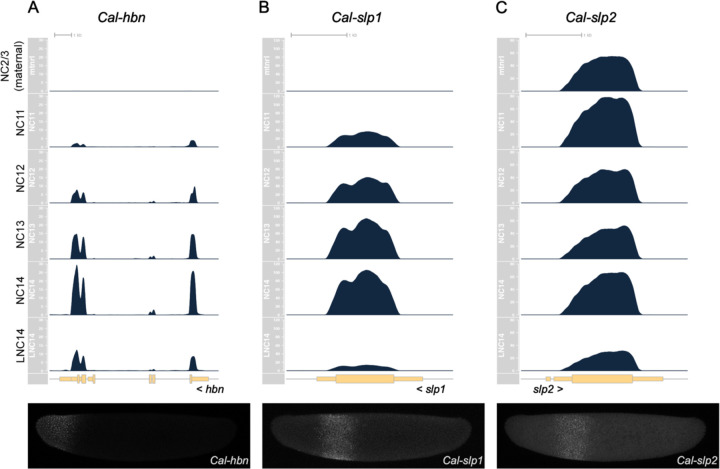
Establishing the anterior-posterior body axis is a fundamental process during embryogenesis, and the fruit fly, Drosophila melanogaster, provides one of the best-known case studies of this process. In Drosophila, localized mRNA of bicoid serves as anterior determinant (AD). Bicoid engages in a concentration-dependent competition with nucleosomes and initiates symmetry-breaking along the AP axis by promoting chromatin accessibility at the loci of transcription factor (TF) genes that are expressed in the anterior of the embryo. However, ADs of other fly species are unrelated and structurally distinct, and little is known about how they function. We addressed this question in the moth fly, Clogmia albipunctata, in which a maternally expressed transcript isoform of the pair-rule segmentation gene odd-paired is localized in the anterior egg and has been co-opted as AD. We provide a de novo assembly and annotation of the Clogmia genome and describe how knockdown of zelda and maternal odd-paired transcript affect chromatin accessibility and expression of TF-encoding loci. The results of these experiments suggest direct roles of Cal-Zld in opening and closing chromatin during nuclear cleavage cycles and show that Clogmia's maternal odd-paired activity promotes chromatin accessibility and anterior expression during the early phase of zygotic genome activation at Clogmia's homeobrain and sloppy-paired loci. We conclude that unrelated dipteran ADs initiate anterior-posterior axis-specification at the level of enhancer accessibility and that homeobrain and sloppy-paired homologs may serve a more widely conserved role in the initiation of anterior pattern formation given their early anterior expression and function in head development in other insects.


Conflict of interest statement

Competing interests The authors declare no competing interests.

Figures

Figure 1:
Figure 1:. Synteny analysis of Drosophila melanogaster chromosomes and Clogmia albipunctata scaffolds.
Synteny analysis between Clogmia albipunctata chromosomes-sized scaffolds and Drosophila melanogaster chromosomes. Groups of collinear genes are represented by contact lines connecting the positions shared between D. melanogaster chromosomes and C. albipunctata scaffolds. Colors correspond to D. melanogaster chromosomes. Positions of developmental genes of interest indicated by a solid purple bar. Position of the HOX gene cluster indicated by a solid brown bar.
Figure 2:
Figure 2:. Changes in chromatin accessibility during NC11 to Late NC14.
A-D) Volcano plots of differentially accessible ATAC-seq peaks between consecutive developmental stages. Significant change of adjusted p-value ≤ 0.05 and |log2 Fold Change| ≥ 1 highlighted; red (log2 Fold Change ≤ −1) and blue (log2 Fold Change ≥ 1). E) Dynamic peak groups produced using DEGreport (141) (R package version 1.38.5). Y-axis, Z-score of abundance. X-axis, stage.
Figure 3:
Figure 3:. Cal-Zld regulates chromatin accessibility and zygotic transcription positively and negatively.
A) Observed expression change of maternal or zygotic genes that are differentially expressed in Cal-zld RNAi embryos. Genes are grouped by maternal or zygotic classification on the y-axis. Log2 Fold Change on the x-axis. Only genes with an adjusted p-value ≤ 0.05 and |log2 Fold Change| ≥ are shown. 1B) Genomic distribution of Cal-zld sensitive peaks that were up-regulated (blue) and down-regulated (red). C) Dynamic groups whose accessibility increases over time are more likely to be Cal-zld sensitive peaks that lose accessibility (Group 8 p-value, 3.4e-176; Group 16 p-value, 8.7e-05; Group 15 p-value, 1.3e-55; Group 12 p-value, 4.6e-12; Group 14 p-value, 7.2e-12) unlike dynamic groups whose accessibility decrease over time or after NC13 (Group 5 p-value, 3.5e-08; Group 1 p-value, 2.7e-12). Dynamic groups whose accessibility decreases over time are more likely to be Cal-zld sensitive peaks that gain accessibility (Group 5 p-value, 1.7e-70; Group 1 p-value, 1.4e-95), unlike dynamic groups whose accessibility increases over time (Group 8 p-value, 3.4e-25; Group 16 p-value, 6.3e-01; Group 15 p-value, 1.8e-11; Group 12 p-value, 9e-05; Group 14 p-value, 2.6e-07). Odds ratios and p-values were calculated by a two-sided Fisher’s exact test on contingency tables constructed by the presence/absence of dynamic groups in Cal-zld sensitive peaks up or down. Only groups with a log2(Odds Ratio) > 1.5 in at least one comparison are shown. D) Position weight matrix (PWM) logo of the Zld motif enriched in Cal-zld sensitive peaks as identified by MEME (top) and the canonical Zld motif in Drosophila melanogaster, shown for reference (bottom).
Figure 4:
Figure 4:. Cal-Opa is required for establishing a selective set of chromatin accessibility peaks.
Volcano plots of differentially accessible peaks between the Cal-opa RNAi group and the alignment control group at A) NC12 and B) NC13. Significant change of adjusted p-value ≤ 0.05 and |log2 Fold Change| ≥ 1 highlighted; red (log2 Fold Change ≤ −1) and blue (log2 Fold Change ≥ 1). C) PWM logos of motifs enriched in all Cal-opa sensitive peaks (n = 326), in Cal-opa sensitive peaks that lose accessibility (n = 277), and in Cal-opa sensitive peaks that gain accessibility (n = 49), as identified by the MEME suite. Data combined for both NC12 and NC13 stages. DNA binding proteins of Drosophila melanogaster that bind to these or similar motifs as identified by MEME are indicated. We include CLAMP in this list as it has been shown to bind GA-rich motifs (see text). E-value denotes the significance of recovered motifs. The canonical Opa motif in Drosophila melanogaster is shown for reference.
Figure 5:
Figure 5:. Cal-opa knockdown leads to the miss-regulation of a small set of transcription factor genes.
Volcano plots of differentially expressed genes between the Cal-opa RNAi group and the alignment control group at A) NC12 and B) NC13. Significant change of adjusted p-value ≤ 0.05 and |log2 Fold Change| ≥ 1 highlighted; red (log2 Fold Change ≤ −1) and blue (log2 Fold Change ≥ 1). The number of transcription factors (TFs) is indicated in the text.
Figure 6:
Figure 6:. Key Cal-Opa targets at NC12.
Gene loci of A) Cal-hbn, B) Cal-slp1, and C) Cal-slp2 at NC12. Top tracks: CPM of ATAC-seq data (Alignment control in blue, Injection control in red, Cal-opa RNAi in yellow). Middle tracks show gene models in pale yellow. Bottom tracks: CPM of RNA-seq data. Peaks with significant changes in accessibility are highlighted in pink. Peaks containing Opa motifs are marked with a plus sign. The y-axis is the same for all tracks of the same data type at each locus. Cal-hbn ATAC-seq: 0–10 CPM. Cal-hbn RNA-seq: 0–10 CPM. Cal-slp1 ATAC-seq: 0–25 CPM. Cal-slp1 RNA-seq: 0–100 CPM. Cal-slp2 ATAC-seq: 0–25 CPM. Cal-slp2 RNA-seq: 0–100 CPM. Blue: Alignment control. Light blue: Injection control. Red: Cal-opa RNAi.
Figure 7:
Figure 7:. Key Cal-Opa targets at NC13.
Gene loci of A) Cal-hbn, B) Cal-slp1, C) Cal-slp2, D) Cal-Kr, E) Cal-D and F) evm.TU.scaffold_4.1328 at NC13. Top tracks: CPM of ATAC-seq data. Middle track gene model in pale yellow. Bottom tracks: CPM of RNA-seq data. Peaks with significant changes in accessibility highlighted in pink. Peaks containing Opa motifs are marked with a plus sign. The y-axis is the same for all tracks of the same data type at each locus. Cal-hbn ATAC-seq: 0–15 CPM. Cal-hbn RNA-seq: 0–25 CPM. Cal-slp1 ATAC-seq: 0–25 CPM. Cal-slp1 RNA-seq: 0–150 CPM. Cal-slp2: ATAC-seq: 0–25 CPM. Cal-slp2 RNA-seq: 0–100 CPM. Cal-Kr ATAC-seq: 0–40 CPM. Cal-Kr RNA-seq: 0–60 CPM. Cal-D ATAC-seq: 0–30 CPM. Cal-D RNA-seq: 0–80 CPM. evm.TU.scaffold_4.1328 ATAC-seq: 0–10 CPM. evm.TU.scaffold_4.1328 RNA-seq: 0–200 CPM. Blue: Alignment control. Light blue: Injection control. Red: Cal-opa RNAi.
Figure 8:
Figure 8:. Time-course RNA-seq data for Cal-hbn, Cal-slp1, and Cal-slp2.
Expression levels (CPM) of A) Cal-hbn, B) Cal-slp1, C) Cal-slp2 at 6 consecutive stages, including NC2/3 (maternal, ~45-minute old embryos), NC11, NC12, NC13, NC14 and Late NC14 are shown above fluorescent in situ hybridization chain reaction (HCR) staining of each gene at NC13. Anterior, left. Dorsal, up. Gene models are shown in pale yellow. The y-axis is the same for all tracks at each locus. Cal-hbn RNA-seq: 0–30 CPM. Cal-slp1 RNA-seq: 0–120 CPM. Cal-slp2 RNA-seq: 0–80 CPM.

Similar articles

References

    1. Driever W, Nüsslein-Volhard C. The bicoid protein determines position in the Drosophila embryo in a concentration-dependent manner. Cell. 1988;54(1):95–104. - PubMed
    1. Driever W, Nüsslein-Volhard C. A gradient of bicoid protein in Drosophila embryos. Cell. 1988;54(1):83–93. - PubMed
    1. St Johnston D, Nüsslein-Volhard C. The origin of pattern and polarity in the Drosophila embryo. Cell. 1992;68(2):201–19. - PubMed
    1. Surkova S, Golubkova E, Mamon L, Samsonova M. Dynamic maternal gradients and morphogenetic networks in Drosophila early embryo. Bio Systems. 2018;173:207–13. - PubMed
    1. Ma J, He F, Xie G, Deng GX. Maternal AP determination in the Drosophila oocyte and embryo. Wiley Interdiscip Rev Dev Biol. 2016;5:562–81. - PubMed

Publication types

LinkOut - more resources