[Preprint]. 2025 Jan 18:2025.01.16.633279.
doi: 10.1101/2025.01.16.633279.

Identification of novel Kv1.3 channel-interacting proteins using proximity labelling in T-cells

Affiliations

Identification of novel Kv1.3 channel-interacting proteins using proximity labelling in T-cells

Dilpreet Kour et al. bioRxiv. .

Abstract

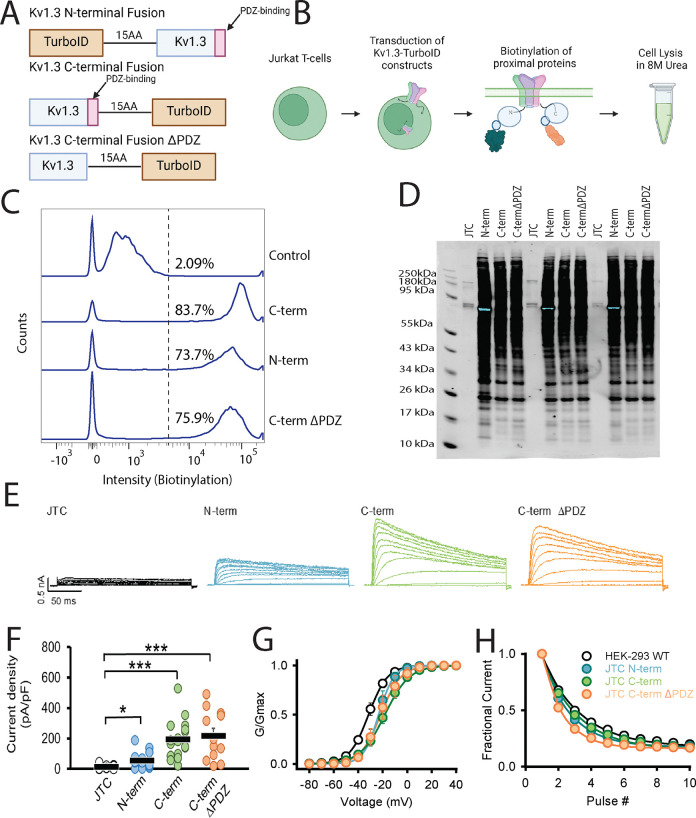
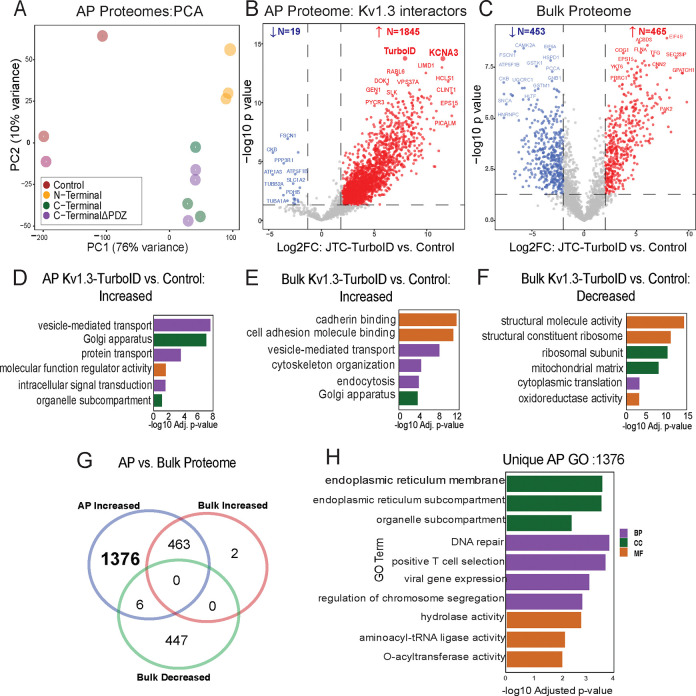
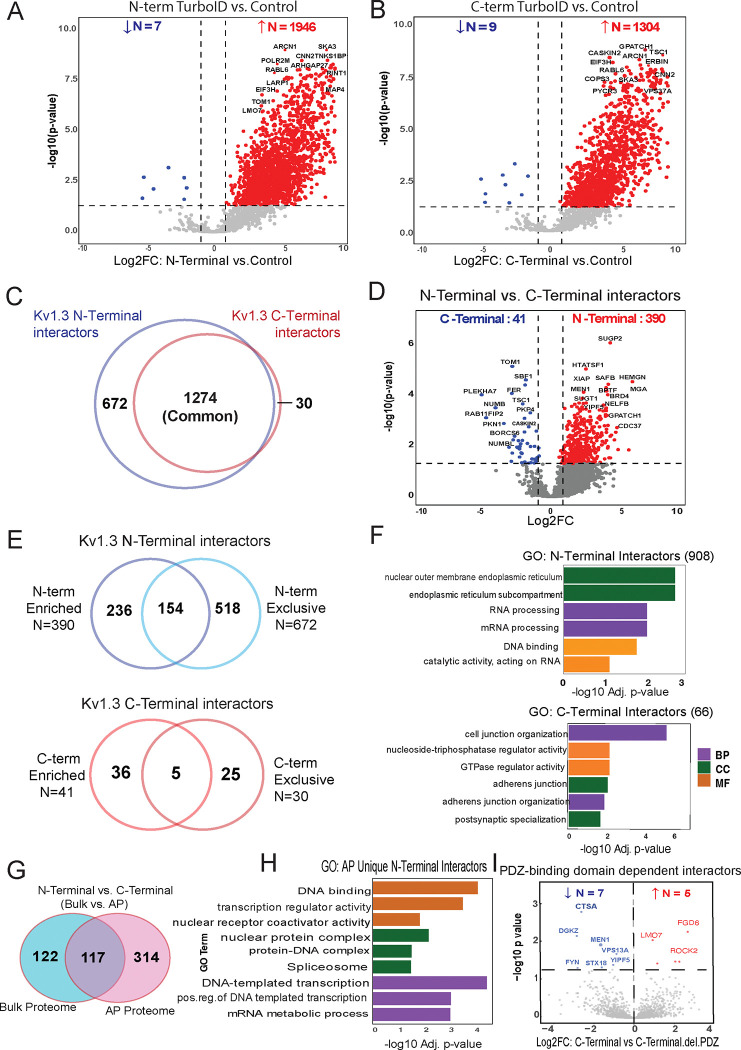
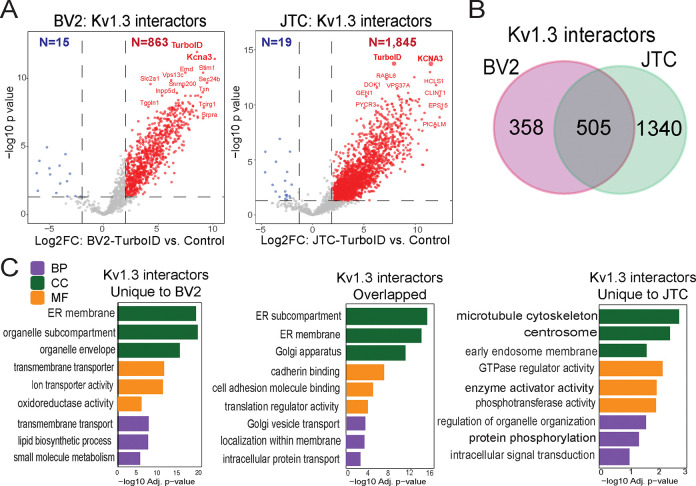
Potassium channels regulate membrane potential, calcium flux, cellular activation and effector functions of adaptive and innate immune cells. The voltage-activated Kv1.3 channel is an important regulator of T cell-mediated autoimmunity and microglia-mediated neuroinflammation. Kv1.3 channels, via protein-protein interactions, are localized with key immune proteins and pathways, enabling functional coupling between K+ efflux and immune mechanisms. To gain insights into proteins and pathways that interact with Kv1.3 channels, we applied a proximity-labeling proteomics approach to characterize protein interactors of the Kv1.3 channel in activated T-cells. Biotin ligase TurboID was fused to either N or C termini of Kv1.3, stably expressed in Jurkat T cells and biotinylated proteins in proximity to Kv1.3 were enriched and quantified by mass spectrometry. We identified over 1,800 Kv1.3 interactors including known interactors (beta-integrins, Stat1) although majority were novel. We found that the N-terminus of Kv1.3 preferentially interacts with protein synthesis and protein trafficking machinery, while the C-terminus interacts with immune signaling and cell junction proteins. T-cell Kv1.3 interactors included 335 cell surface, T-cell receptor complex, mitochondrial, calcium and cytokine-mediated signaling pathway and lymphocyte migration proteins. 178 Kv1.3 interactors in T-cells also represent genetic risk factors of T cell-mediated autoimmunity, including STIM1, which was further validated using co-immunoprecipitation. Our studies reveal novel proteins and molecular pathways that interact with Kv1.3 channels in adaptive (T-cell) and innate immune (microglia), providing a foundation for how Kv1.3 channels may regulate immune mechanisms in autoimmune and neurological diseases.

Keywords: Potassium channel; T cell; autoimmune disease; interactions; proteomics; proximity labeling.


Conflict of interest statement

STATEMENTS Statement of Ethics The authors have no ethical conflicts to disclose. Disclosure Statement The authors have no conflicts of interest to declare.

Figures

Figure 1:
Figure 1:. TurboID biotinylates proteins in Kv1.3-TurboID transduced Jurkat T-cells.
(A) Constructs utilized for transduction into Jurkat T-cells (JTC). Three constructs were used: a fusion of TurboID to the N-terminus of Kv1.3, a fusion of TurboID to the C-terminus of Kv1.3, and the C-terminal fusion with the PDZ-binding domain deleted. (B) Schematic of experimental design. Jurkat T-cells were transfected with Kv1.3-TurboID fusion constructs then exposed to biotin. Cells were then lysed in 8M urea. (C) Flow cytometry analysis shows transduced cells have higher biotin present than control cells (n=3). (D) Western blot utilizing streptavidin-680 shows distinct biotinylation patterns in each transduced cell line (n=3). (E) Representative currents recorded from wild-type JTC activated with concanavalin A (5 μg/mL), JTC transduced with N-terminal fusion Kv1.3 (N-term), Kv1.3 C-terminal fusion (C-term), and C-terminal fusion with the PDZ-binding domain deleted (C-termΔPDZ) constructs. Currents elicited by a voltage step protocol from holding potential of −80 mV to +60 mV in 10 mV increments. (F) Current density calculated from peak currents induced by the +40-mV depolarization step in wild-type JTC (n=18), N-term (n=17), C-term (n=18), and C-termΔPDZ (n=12). (G) Conductance-voltage relationship depicting voltage-dependence of activation of WT Kv1.3 construct transfected in HEK-293 (V1/2 = −31.4 ± 1.7 mV, n=8), and JTC transduced with N-term (V1/2 = −23.6 ± 6.0 mV, n=6), C-term (V1/2 = −18.8 ± 6.0 mV, n=6), and C-termΔPDZ (V1/2 = −21.1 ± 10.2 mV, n=7) fusion constructs. (H) Fractional currents showing no changes in use-dependent current reduction of Kv1.3 currents in JTC transduced with N-term (n=9), C-term (n=10), and C-termΔPDZ (n=8) in comparison with wild-type Kv1.3 transfected in HEK-293 (n=8). Statistical significance denotes p < 0.05 (*) and p < 0.001 (***). BioRender software was used to generate Fig 1B.
Figure 2:
Figure 2:. Comparative analysis of biotinylated proteins in JTC Bulk vs. JTC affinity purified samples.
(A) Principal Component Analysis (PCA) of proteins from Kv1.3-TurboID transduced Jurkat T-cells and control samples (n=3). PC1 and PC2 explain 76% and 10% of the variance, respectively. Distinct clustering of sample groups reflects significant differences in each sample proteome. (B) Volcano Plot for JTC Affinity Purified (AP) Samples: Differential Enrichment Analysis (DEA) between all Kv1.3-TurboID fusion and control in affinity purified (AP) samples, showing 1845 proteins enriched with Kv1.3 channel transduction. (C) Volcano Plot for JTC Bulk Samples: DEA of all Kv1.3-TurboID fusion and control in bulk samples showing similar number of proteins increased (465) and decreased (453) with Kv1.3 channel transduction at bulk level. (D) Gene Ontology (GO) enrichment for increased proteins in AP samples identifies Kv1.3 enriched proteome involved in protein transport and signal transduction pathways. (E) GO Enrichment for increased proteins in JTC Bulk shows cadherin binding and vesicle mediated transport pathways enrichment with Kv1.3-TurboID fusion in bulk sample. (F) GO Enrichment analysis of decreased proteins in JTC bulk samples DEA shows downregulation of RNA processing, cytosolic translation, and mitochondrial function with Kv1.3 channel in bulk samples. (G) Venn diagram illustrates the overlap and unique proteins identified across JTC bulk and JTC affinity purified samples, with 1376 Kv1.3 enriched proteins unique to AP proteome, and overlap of 469 proteins with DEPs in bulk samples. (G) GO analysis for unique AP-Kv1.3 interacting proteins identified in Fig 2G emphasizes enrichment of processes associated with endoplasmic reticulum organization, membrane-associated trafficking, and Golgi-mediated vesicular transport, suggesting role of Kv1.3 in regulating protein localization and intracellular membrane dynamics. Complete protein list for each analysis is given in Supp. Datasheet 3.
Figure 3:
Figure 3:. Distinct protein dynamics and enriched pathways in N-Terminal and C-Terminal interactors of Kv1.3 channel.
(A) DEA of N-Terminal-TurboID and Control JTC, illustrates 1946 interactors of Kv1.3 channel’s N-terminal. (B) DEA of C-Terminal-TurboID and Control JTC, highlights 130 proteins enriched at Kv1.3 channel’s C-terminal. (C) Intersection of N-terminal (1946) and C-terminal (1304) interactors reveal 672 unique proteins associated with N-terminal and 30 with C-terminal. (D) DEA of N-terminal-TurboID and C-terminal-TurboID JTCs shows distinct N- (390) and C-terminal (41) interactors of Kv1.3 channel. (E) Venn diagram analysis intersecting N-terminal or C-terminal specific proteins identified in Fig 3C and D, shows 908 and 66 unique proteins for N-terminal and C-terminal, respectively. (F) GO term enrichment analysis for unique N- and C-terminal interactors identified in Fig 3E identifies protein processing function of N-terminal and cell signaling function of C-terminal. (G) Intersection of DEPs from N-terminal and C-terminal DEA at AP and bulk level shows 314 proteins differentially expressing only in AP proteome. Further analysis showed 310 and 4 are interactors of N-terminal and C-terminal, respectively. (H) GO term enrichment analysis for only AP proteome N-terminal interactors shows terminal role in transcription. (I) DEA between C-terminal and C-terminal with PDZ-binding domain removed shows 5 proteins increased and 7 decreased with domain deletion. All analyses are given in detail in Supp. Datasheet 4.
Figure 4:
Figure 4:. Comparative analysis of Kv1.3 channel interactome in BV-2 microglia and Jurkat T-Cells (JTC).
(A) DEA between TurboID and Control sample identifies 863 interactors of Kv1.3 channel in BV-2 microglial cells while 1845 are interactors of Kv1.3 channel in JTC (n=3). (B) Intersection of BV-2 and JTC Kv1.3 interactors shows 358 and 1340 proteins unique to BV-2 and JTCs, respectively, along with an overlap of 505 channel interactors across given cell-types. (C) GO term enrichment analysis shows mitochondrial and metabolic function of Kv1.3 interactors in BV-2, while GTPase regulator and signaling role of channel interactors in JTCs. Overlapping proteins are associated with protein transport and localization. Detail analysis is given in Supp. Datasheet 5.
Figure 5:
Figure 5:. Transmembrane interactors of Kv1.3 channel in BV-2 microglia and Jurkat T-Cells (JTC).
(A) Venn diagram of JTC-Kv1.3 interactors and membrane proteins highlight 335 membrane proteins in Kv1.3 interactome in JTCs. (B) STRING network analysis of 335 membrane interactors of Kv1.3 channel identifies 55 plasma membrane and 32 mitochondrial membrane proteins interacting with Kv1.3 channel in JTCs. (C) Venn diagram analysis between membrane proteins and BV-2 Kv1.3 interactors shows 280 membrane proteins in Kv1.3 interactome in BV-2 microglial cell. (D) Network analysis of 280 membrane Kv1.3 interactors in BV-2 illustrates 35 and 14 of these are plasma and mitochondrial membrane interactors, respectively. (E) Intersection between membrane interactors of Kv1.3 channel in BV-2 and JTCs shows 182 are JTC and 127 are BV-2 unique interactors, while 153 are shared across cell-type. (F) Intersection between plasma membrane interactors of Kv1.3 channel in BV-2 and JTC displays 43 distinct interactors in JTCs, while 23 are specific to BV-2 cells. 12 shared plasma membrane interactors among JTCs and BV-2 are highlighted. (G) STRING analysis reveals functional clustering of overlapping proteins (153) in JTC and BV-2 Kv1.3 membrane interactors intersection given in Fig 5E. Panels highlight proteins involved in cell surface interactions at the vascular wall, focusing on adhesion and signaling, proteins associated with ER to Golgi vesicle-mediated transport, emphasizing their roles in intracellular trafficking and vesicle formation and ER protein-containing complex, illustrating proteins critical for ER organization and protein folding. Complete table of each analysis is given in Supp. Datasheet 6.
Figure 6:
Figure 6:. Comparative molecular analyses between Kv1.3 interactors and autoimmune diseases associated risk genes
(A) Intersection of autoimmune diseases associated risk genes and Kv1.3 interactors shows 178 Kv1.3 enriched proteins in JTCs are risk factor for autoimmune conditions. (B) GO term enrichment analysis of 178 Kv1.3 interacting autoimmune risk genes highlights their role in immune response and signaling. STRING analyses illustrating protein-protein interactions shows (C) T-cell receptor complex, (D) Cytokine-mediated signaling pathway and (E) Actin filament bundle assembly or lymphocyte migration functional clusters in Kv1.3 interacting autoimmune risk genes found in JTCs. (F) Western blot following co-immunoprecipitation showing Kv1.3 direct interaction with STIM1 and no physical interaction with CD3E, using V5-tag fused to TurboID. (IP-Immunoprecipitation) (n=3). Table showing details of each analysis is given in Supp. Datasheet 7.

References

    1. Shah K, Al-Haidari A, Sun J, Kazi JU. T cell receptor (TCR) signaling in health and disease. Signal transduction and targeted therapy. 2021;6(1):412. - PMC - PubMed
    1. Hosokawa H, Rothenberg EV. Cytokines, transcription factors, and the initiation of T-cell development. Cold Spring Harbor perspectives in biology. 2018;10(5):a028621. - PMC - PubMed
    1. Hosokawa H, Rothenberg EV. How transcription factors drive choice of the T cell fate. Nature Reviews Immunology. 2021;21(3):162–76. - PMC - PubMed
    1. Sun L, Su Y, Jiao A, Wang X, Zhang B. T cells in health and disease. Signal transduction and targeted therapy. 2023;8(1):235. - PMC - PubMed
    1. He X, He X, Dave VP, Zhang Y, Hua X, Nicolas E, et al. The zinc finger transcription factor Th-POK regulates CD4 versus CD8 T-cell lineage commitment. Nature. 2005;433(7028):826–33. - PubMed

Publication types