

This is a preprint.
The Role of Genetic Variation in Shaping Phenotypic Responses to Diet in Aging Drosophila melanogaster
- PMID: 39868103
- PMCID: PMC11761520
- DOI: 10.1101/2025.01.09.632132
The Role of Genetic Variation in Shaping Phenotypic Responses to Diet in Aging Drosophila melanogaster
Abstract
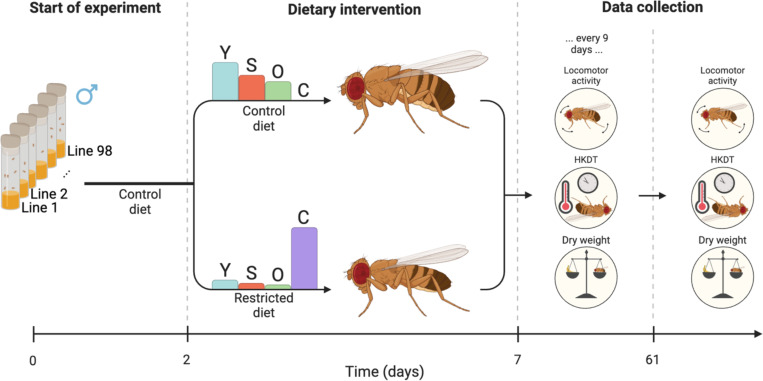
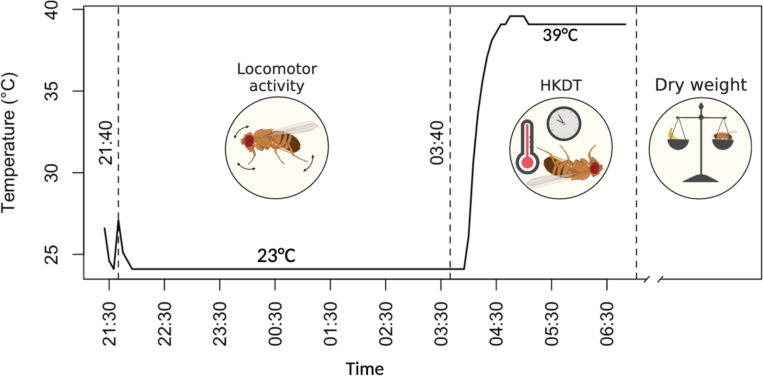
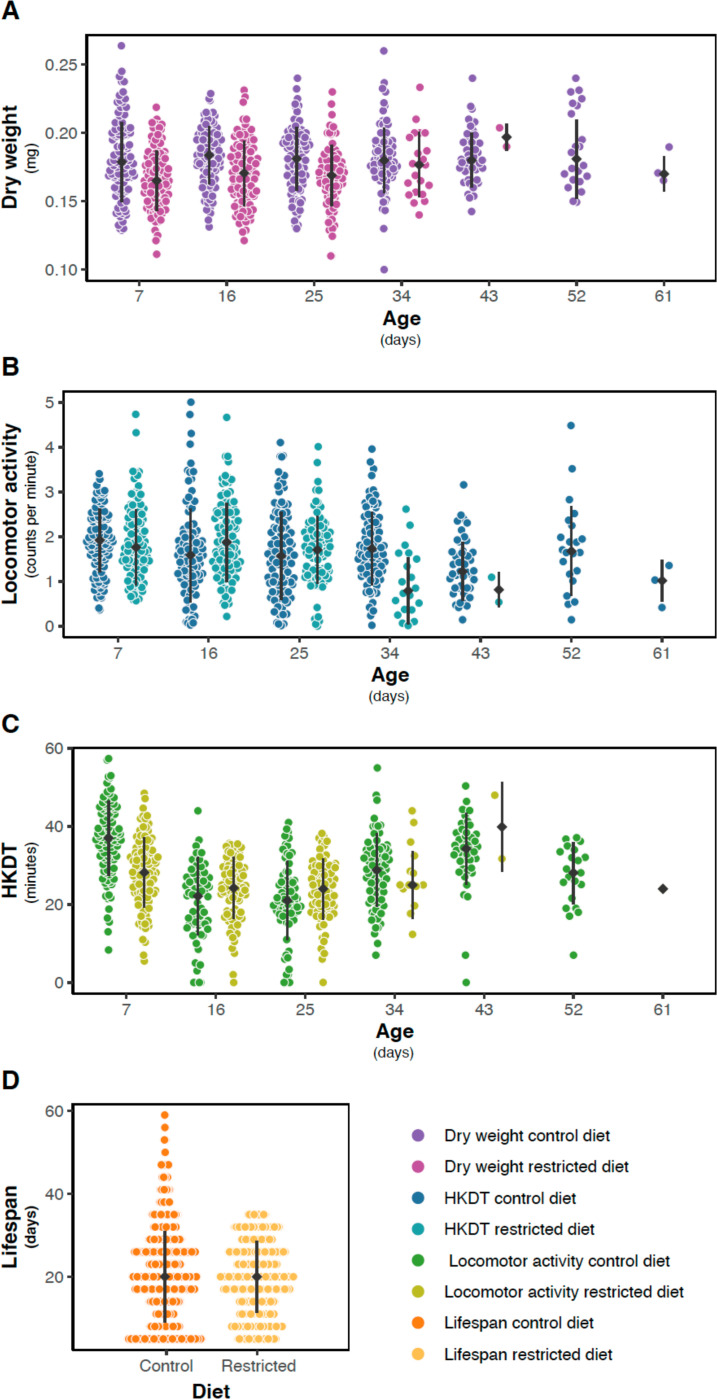
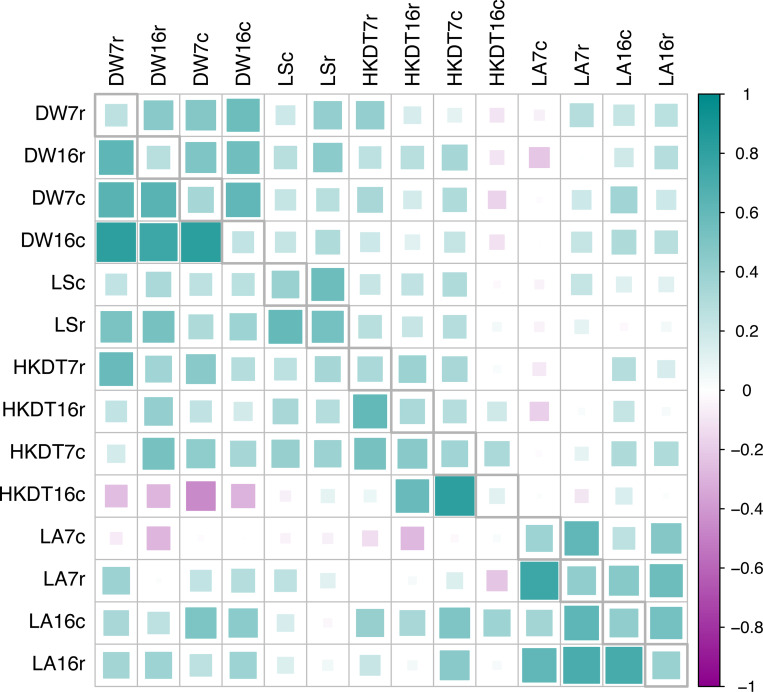
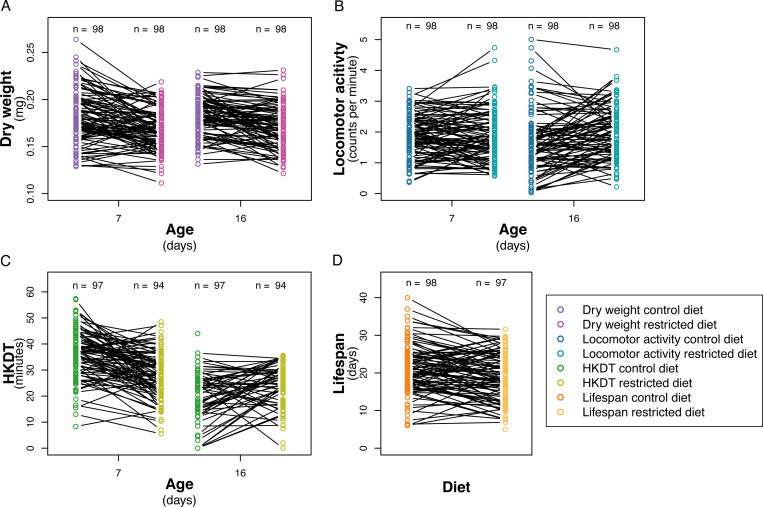
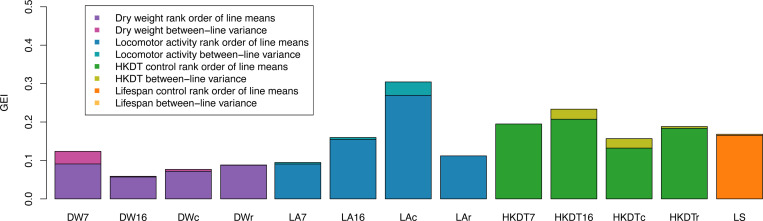
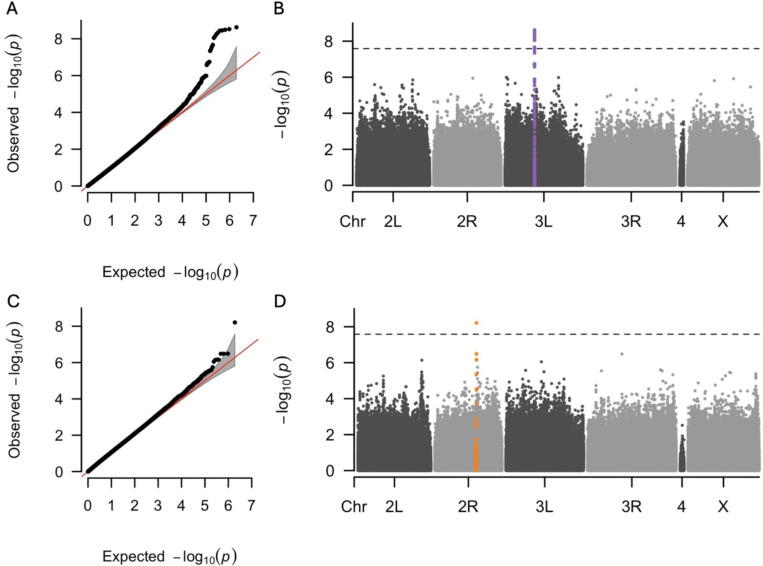
Nutrition plays a central role in healthy living, however, extensive variability in individual responses to dietary interventions complicates our understanding of its effects. Here we present a comprehensive study utilizing the Drosophila Genetic Reference Panel (DGRP), investigating how genetic variation influences responses to diet and aging. Quantitative genetic analyses of the impact of dietary restriction on lifespan, locomotor activity, dry weight, and heat knockdown time were performed. Locomotor activity, dry weight and heat knockdown time were measured on the same individual flies. We found significant genotype-by-diet interaction (GDI) and genotype-by-age interaction (GAI) for all traits. Therefore, environmental factors play a crucial role in shaping trait variation at different ages and diets, and/or distinct genetic variation influences these traits at different ages and diets. Our genome wide association study also identified a quantitative trait locus for age-dependent dietary response. The observed GDI and GAI indicates that susceptibility to environmental influences changes as organisms age, which could have significant implications for dietary recommendations and interventions aimed at promoting healthy aging in humans. The identification of associations between DNA sequence variation and age-dependent dietary responses opens new avenues for research into the genetic mechanisms underlying these interactions.
Conflict of interest statement
Conflicts of interest The authors declare no conflicts of interest.
Figures
Similar articles
-
GWAS for Lifespan and Decline in Climbing Ability in Flies upon Dietary Restriction Reveal decima as a Mediator of Insulin-like Peptide Production.Curr Biol. 2020 Jul 20;30(14):2749-2760.e3. doi: 10.1016/j.cub.2020.05.020. Epub 2020 Jun 4. Curr Biol. 2020. PMID: 32502405 Free PMC article.
-
G×G×E for lifespan in Drosophila: mitochondrial, nuclear, and dietary interactions that modify longevity.PLoS Genet. 2014 May 15;10(5):e1004354. doi: 10.1371/journal.pgen.1004354. eCollection 2014. PLoS Genet. 2014. PMID: 24832080 Free PMC article.
-
Genetic and metabolomic architecture of variation in diet restriction-mediated lifespan extension in Drosophila.PLoS Genet. 2020 Jul 9;16(7):e1008835. doi: 10.1371/journal.pgen.1008835. eCollection 2020 Jul. PLoS Genet. 2020. PMID: 32644988 Free PMC article.
-
Charting the genotype-phenotype map: lessons from the Drosophila melanogaster Genetic Reference Panel.Wiley Interdiscip Rev Dev Biol. 2018 Jan;7(1):10.1002/wdev.289. doi: 10.1002/wdev.289. Epub 2017 Aug 22. Wiley Interdiscip Rev Dev Biol. 2018. PMID: 28834395 Free PMC article. Review.
-
Dietary glycation compounds - implications for human health.Crit Rev Toxicol. 2024 Sep;54(8):485-617. doi: 10.1080/10408444.2024.2362985. Epub 2024 Aug 16. Crit Rev Toxicol. 2024. PMID: 39150724
References
-
- Pearl Raymond. Experiments on Longevity. Q Rev Biol. 1928. May 9;3(3):391–407.
-
- Percy Baumberger J. Studies in the Longevity of Insects. Ann Entomol Soc Am. 1914. Dec 1;7(4):323–53.
-
- George LK, Palmore E, Cohen HJ. The Duke Center for the Study of Aging: One of Our Earliest Roots. Gerontologist. 2014. Feb 1;54(1):59–66. - PubMed
-
- Le Bourg E. Lifespan Versus Healthspan. In 2020. p. 439–52.
Publication types
Grants and funding
LinkOut - more resources
Full Text Sources