[Preprint]. 2025 Jan 13:2024.12.19.629472.
doi: 10.1101/2024.12.19.629472.

TEAD switches interacting partners along neural progenitor lineage progression to execute distinct functions

Affiliations

TEAD switches interacting partners along neural progenitor lineage progression to execute distinct functions

Charles H Perry et al. bioRxiv. .

Update in

Abstract

The TEAD family of transcription factors are best known as the DNA-binding factor in the Hippo pathway, where they act by interacting with transcriptional coactivators YAP and TAZ (YAP/TAZ). Despite the importance of the Hippo pathway, the in vivo functions of TEAD in mammals have not been well established. By comparing mouse mutants lacking TEAD1 and TEAD2 (TEAD1/2) to those lacking YAP/TAZ, we found that TEAD1/2 have both YAP/TAZ-dependent and -independent functions during ventral telencephalon development. TEAD1/2 loss and YAP/TAZ loss similarly disrupt neuroepithelial apical junctions. However, the impacts of their losses on progenitor lineage progression are essentially opposite: Whereas YAP/TAZ loss depletes early progenitors and increases later progenitors-consistent with their established function in promoting progenitor self-renewal and proliferation, TEAD1/2 loss expands early progenitors and reduces late progenitors, indicating that TEAD1/2 promote lineage progression. We further show that TEAD1/2 promote neural progenitor lineage progression by, at least in part, inhibiting Notch signaling and by cooperating with Insulinoma-associated 1 (INSM1). Orthologs of TEAD and INSM1 have been shown to cooperatively regulate neuronal cell fate decisions in worms and flies. Our study reveals a remarkable evolutionary conservation of the function of this transcription factor complex during metazoan neural development.

Keywords: VGLL4; apical progenitor; basal ganglia; basal progenitor; intermediate progenitor; interneuron; medial ganglionic eminence (MGE); neurogenesis; radial glia; subapical progenitor.


Conflict of interest statement

Competing Interest Statement The authors declare no competing interests.

Figures

Figure 1.
Figure 1.
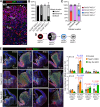
Expression patterns of YAP/TAZ and TEAD in the developing forebrain and gross phenotypes of their mutants. (A) YAP/TAZ and TEAD1 expression patterns in E13.5 forebrain sections examined by immunostaining. White dashed lines delineate the boundary between the ventricular zone (VZ) and the subventricular zone (SVZ). Yellow dashed lines mark the outer surface of the cortex. MGE, medial ganglionic eminence; LGE, lateral ganglionic eminence. (B) YAP/TAZ and TEAD1 immunostaining on E13.5 forebrain sections co-stained with phosphor-histone H3 (pH3, cells in mitosis) and βIII-tubulin (TUJ1, neurons), highlighting apical progenitors (APs) that divide at the ventricular surface (VS), subapical progenitors (SAPs) that divided at subapical positions within the VZ, and basal progenitors (BPs) that divide in the SVZ. Dashed lines delineate the VS. Asterisks, autofluorescent blood vessels. (C) Quantification of the proportion of pH3+ cells at the respective locations. Values are mean ± SEM. (D) Immunostaining showing the gross phenotypes of Nestin-Cre mediated Yap;Taz double knockout (dKO) and Tead1;2 dKO forebrain at E17.5. Dashed lines mark the outer surface of the forebrain. Arrows highlight disruptions in the VS and VZ-SVZ organization.
Figure 2.
Figure 2.
TEAD1/2 loss and YAP/TAZ loss have distinct impacts on subpallial neural progenitor lineage progression. (A) Immunostaining on a E13.5 brain section, highlighting an apical progenitor (AP), a subapical progenitor (SAP), and a basal progenitor (BP) in the MGE. (B and C) Quantification of the proportion of pH3+ cells found at different locations. (D) A schematic of proposed progenitor states during subpallial neural progenitor lineage progression. (E) Immunostaining and quantification of progenitors in the states defined by OLIG2 and ASCL1 immunosignal. N = 6 control mice with 3 from each line, N = 3 dKO mice. Areas in dashed boxes are enlarged in the images to the right. MGE, medial ganglionic eminence. LGE, lateral ganglionic eminence. Values are mean ± SEM. Each data point represents an individual animal. Two-sided unpaired t-test. Unmarked comparisons (vs. control) did not show significant difference (P > 0.05).
Figure 3.
Figure 3.
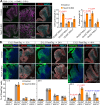
TEAD1/2 loss and YAP/TAZ loss have distinct impacts on the cellular output from subpallial progenitors. (A) Immunostaining and quantification of neurons (TUJ1) in the MGE (dashed area). (B) Immunostaining and quantification of immature interneurons (MAFB) in the neocortex. (C and D) Immunostaining and quantification of oligodendrocyte lineage cells (OLIG2 and SOX10) in the neocortex. Areas in dashed boxes are enlarged in the images to the right. Arrowheads highlight OLIG2- and SOX10-labeled cells located at the ventricular surface. Blue color is DAPI signal. Dotted lines mark the outer surface of the cortex. Values are mean ± SEM. Each data point represents an individual animal. Two-sided unpaired t-test. Unmarked comparisons (vs. control) did not show significant difference (P > 0.05).
Figure 4.
Figure 4.
Single-cell RNA sequencing analysis reveals distinct impacts of TEAD1/2 loss and YAP/TAZ loss on MGE neural progenitor lineage progression. (A) Clustering of WT MGE cells (which included E12.5 WT, E14.5 Tead1;2 control, and E15.5 WT cells; n = 42,876 cells after quality control) based on highly variable genes (HVG) visualized by UMAP. (B–D) UMAP visualizations of progenitor score, neuron score, and cell-cycle phase of WT MGE cells. (E) Cell cycle phase of WT progenitor cells (cells from clusters 2, 3, and 6 in A; n = 18,963 cells after quality control) visualized by UMAP using a curated list of transcription factors for feature selection. (F–H) UMAP visualizations of VZ score, SVZ-MZ score, and pseudotime of WT progenitor cells. (I) Clustering of WT progenitor cells based on the list of transcription factors at the resolution of 0.25. PS, progenitor state. (J) ScRNA-seq expression levels of indicated genes in each progenitor state. (K) Clustering of WT and KO MGE cells (which included E12.5 WT, E14.5 Tead1;2 control and dKO, E14.5 Yap;Taz control and dKO, and E15.5 WT cells; n = 85,684 cells after quality control) based on HVG visualized by UMAP. (L–N) UMAP visualizations of progenitor score, neuron score, and cell-cycle phase of WT and KO cells. (O) Progenitor state annotation of WT and KO MGE progenitor cells (cells from clusters 2, 3, and 5 in K; n = 38,860 cells after quality control) visualized by UMAP using the list of transcription factors for feature selection. (P) Fraction of progenitor cells in each progenitor state. Values are mean ± SEM. Each data point represents an individual animal. Statistical test was performed using propeller. Unmarked comparisons (vs. control) did not show significant difference (P > 0.05).
Figure 5.
Figure 5.
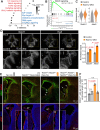
TEAD1/2 loss impedes developmental progression of subpallial neural progenitors. (A) Immunostaining and quantification measuring the cell cycle speed of MGE progenitor cells by EdU-BrdU sequential labeling. Areas in dashed boxes are enlarged in the images to the right. (B) Immunostaining and quantification of the fraction of FlashTag-labeled cells in the progenitor states defined by OLIG2 and ASCL1 immunosignal. Values are mean ± SEM. Each data point represents an individual animal. Two-sided unpaired t-test. Unmarked comparisons (vs. control) did not show significant difference (P > 0.05).
Figure 6.
Figure 6.
TEAD1/2 promote lineage progression of subpallial neural progenitors by inhibiting Notch signaling. (A) Top 5 enriched Hallmark gene sets by gene set enrichment analysis (GSEA) comparing Tead1;2 dKO to control PS2 cells. (B) Enrichment plot of the Notch_signaling gene set. (C) ScRNA-seq expression levels of Notch1 (log2FC = 0.17, adj.P.val = 0.001) and Hes5 (log2FC = 2.24, adj.P.val = 2.8E−143) in PS2 cells comparing Tead1;2 dKO vs. control. (D) RNAscope in situ hybridization analysis of Notch1 and Hes5 expression in E13.5 brain sections. Areas in dashed boxes are enlarged in the images below. Mean fluorescence intensity in the MGE (total signals divided by area) were normalized to the mean intensity in a cortical VZ region within the same section. (E) Immunostaining of neural progenitors (SOX2 and ASCL1) and apical junctions (aPKC) in P0 brain sections. Arrows highlight disruptions in the VS and VZ-SVZ organization. CP, choroid plexus. (F) Quantification of ASCL1+ cells located in subpallial VZ-SVZ in P0 brain sections. Values in D and F are mean ± SEM. Two-sided unpaired t-test; n.s., not significant (P > 0.05). Each data point represents an individual animal.
Figure 7.
Figure 7.
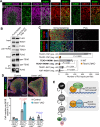
INSM1 interacts with TEAD and promote lineage progression of subpallial neural progenitors. (A) INSM1 expression pattern in E12.5 MGE examined by immunostaining. Dashed lines delineate VZ and SVZ boundary. (B) Co-immunoprecipitation experiment using 293T cells transfected with FLAG-tagged INSM1 or DLX2 (negative control) to examine the interaction between endogenous TEAD and FLAG-tagged proteins. (C) Immunostaining and proximity ligation assay (PLA) images of adjacent E12.5 brain sections showing subpallial regions and quantification of PLA signals as fluorescent spots. R, rabbit antibody; M, mouse antibody. (D) Immunostaining and quantification of neural progenitors in E14.5 MGE. Values are mean ± SEM. Each data point represents an individual animal. Two-sided unpaired t-test. Unmarked comparisons (vs. control) did not show significant difference (P > 0.05). (E) A model of TEAD function during subpallial development. TEAD interacts with different partners in different progenitor subtypes/states to execute distinct functions. In apical progenitors (APs), TEAD interacts with YAP/TAZ to promote the expression of cell junction genes; whether TEAD also promotes self-renewal with YAP/TAZ remains to be determined. In subapical progenitors (SAPs) and possibly a subset of basal progenitors (BPs), TEAD interacts with INSM1 to promote lineage progression at least in part by inhibiting Notch signaling. N, neurons; O, oligodendrocytes; A, astrocytes. Created with BioRender.com.

References

    1. Allen Institute for Brain Science. Allen Brain Atlas Developing Mouse Brain [dataset].
    1. Allaway KC, Gabitto MI, Wapinski O, Saldi G, Wang CY, Bandler RC, Wu SJ, Bonneau R, Fishell G. 2021. Genetic and epigenetic coordination of cortical interneuron development. Nature 597: 693–697. - PMC - PubMed
    1. Anderson SA, Eisenstat DD, Shi L, Rubenstein JL. 1997. Interneuron migration from basal forebrain to neocortex: dependence on Dlx genes. Science 278: 474–476. - PubMed
    1. Cai J, Choi K, Li H, Pulgar Prieto KD, Zheng Y, Pan D. 2022. YAP-VGLL4 antagonism defines the major physiological function of the Hippo signaling effector YAP. Genes Dev 36: 1119–1128. - PMC - PubMed
    1. Cao X, Pfaff SL, Gage FH. 2008. YAP regulates neural progenitor cell number via the TEA domain transcription factor. Genes Dev 22: 3320–3334. - PMC - PubMed

Publication types

LinkOut - more resources