[Preprint]. 2025 Jan 18:2025.01.14.633015.
doi: 10.1101/2025.01.14.633015.

Inflammatory disease microbiomes share a functional pathogenicity predicted by C-reactive protein

Affiliations

Inflammatory disease microbiomes share a functional pathogenicity predicted by C-reactive protein

Graham J Britton et al. bioRxiv. .

Abstract

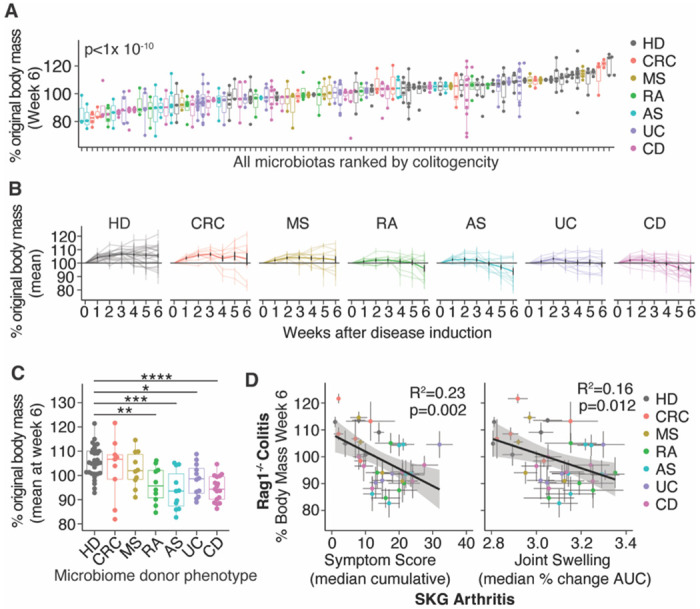
We examine disease-specific and cross-disease functions of the human gut microbiome by colonizing germ-free mice, at risk for inflammatory arthritis, colitis, or neuroinflammation, with over 100 human fecal microbiomes from subjects with rheumatoid arthritis, ankylosing spondylitis, multiple sclerosis, ulcerative colitis, Crohn's disease, or colorectal cancer. We find common inflammatory phenotypes driven by microbiomes from individuals with intestinal inflammation or inflammatory arthritis, as well as distinct functions specific to microbiomes from multiple sclerosis patients. Inflammatory disease in mice colonized with human microbiomes correlated with systemic inflammation, measured by C-reactive protein, in the human donors. These cross-disease patterns of human microbiome pathogenicity mirror features of the inflammatory diseases, including therapeutic targets and the presence or absence of systemic inflammation, suggesting shared and disease-specific mechanisms by which the microbiome is shaped and drives pathogenic inflammatory responses.


Conflict of interest statement

Competing interests: JJF is on the scientific advisory board of Vedanta Biosciences, reports receiving research grants from Janssen Pharmaceuticals, and reports receiving consulting fees from Innovation Pharmaceuticals, Janssen Pharmaceuticals, BiomX, and Vedanta Biosciences. AND and DG were employees of Janssen Research and Development LLC at the time of this work. SS and DG are current employees of Seed Health. DRL is a founder and adviser to Vedanta Biosciences. PB has received institutional research funding from Merck, Benevolent AI, GSK, Regeneron and Novartis. KR has received research grant support from Bristol Myers Squibb and personal fees for lecturing or consultancy activity from Abbvie and Sanofi. Other authors declare they have no competing interests.

Figures

Fig. 1:
Fig. 1:. In contrast to other IMID microbiomes, microbiomes from humans with multiple sclerosis exacerbate EAE.
(A), EAE severity in mice colonized with one of 56 different human microbiomes (median cumulative EAE scores for each mouse). P value calculated by ANOVA. (B), EAE scores over time of mice colonized with different human microbiomes. Lighter colored lines show median data of mice colonized with each microbiome; darker lines show the weighted mean EAE scores +/− SEM of mice colonized with microbiomes from humans with the indicated disease. (C), Peak EAE severity (median score at day 18 after induction) and EAE disease burden (cumulative disease score day 0-25) of groups of mice colonized with different human microbiomes. *p<0.05, **p<0.01, Dunnett’s test with BH correction comparing each disease group to HD group. Non-MS IMID refers to data from all donors with AS, RA, CD or UC. In all panels, N human microbiomes of each disease tested in n mice: AS, N=8, n=41; CD, N=7, n=43; CRC, N=7, n=42; HD, N=9, n=55; MS, N=9, n=43; RA, N=7, n=37; UC, N=9, n=45. Boxplots show median +/− IQR in the style of Tukey.
Fig. 2:
Fig. 2:. Microbiomes from humans with diverse IMID enhance arthritis severity in susceptible mice.
(A), Arthritis severity in SKG mice colonized with one of 35 different human microbiomes (points shows the cumulative symptom score of individual mice). Colors indicate the health status of the microbiome donor. P value calculated by ANOVA. (B), Arthritis symptom scores, joint swelling (percentage change in joint dimensions from baseline) and change in body mass over time following disease induction in groups of mice colonized with different human microbiomes. Lighter colored lines show median (symptom scores) or mean (joint swelling and body mass) data of groups of mice colonized with each microbiome; darker lines show the median +/− SEM (symptom scores) or mean +/− SEM (joint swelling and body mass) of mice colonized with microbiomes from humans with the indicated disease. (C), Median symptom scores (cumulative), joint swelling (area under the curve; AUC) and body mass change of mice colonized with microbiomes from each disease type. *p<0.05, **p<0.01, Dunnett’s test comparing disease group to HD group. In all panels, N human microbiomes of each disease tested in n mice: AS, N=5, n=30; CD, N=5, n=36; CRC, N=5, n=19; HD, N=5, n=25; MS, N=5, n=17; RA, N=5, n=26; UC, N=5, n=33. Boxplots show median +/− IQR in the style of Tukey.
Fig. 3:
Fig. 3:. Microbiomes from humans with diverse IMID enhance colitis severity in susceptible mice
(A), Median colitis severity six weeks after naïve T cell transfer (as assessed by loss in body mass) in groups of Rag1−/− mice colonized with one of 99 different human microbiomes. P value calculated by ANOVA. (B), Change in body mass over time of groups of mice colonized with different human microbiomes. Lighter colored lines show mean +/− SEM change in body mass of mice colonized with each microbiome; darker lines show the weighted mean +/− SEM change in body mass of mice colonized with microbiomes from humans with the indicated disease. Grey horizontal lines indicate baseline body mass. (C), The median change in body mass six weeks after naïve T cells transfer in groups of mice colonized with human microbiomes from donors with different heath statuses. Each point represents mean data of a group of mice colonized with a single microbiome. * p<0.05, ** p<0.01, ***p<0.001, ****p<0.0001 Dunnett’s test comparing disease groups to HD. (D), A comparison of disease severity in the colitis model (change in body mass) and the SKG arthritis model (left panel; symptom score, right panel; joint swelling) in groups of mice colonized with the same human microbiomes. In panels A-C, N human microbiomes of each disease tested in n mice: AS, N=11, n=36; CD, N=17, n=75; CRC, N=9, n=29; HD, N=30, n=116; MS, N=10, n=29; RA, N=10, n=34; UC, N=11, n=72. In panel D, total microbiomes = 36. Boxplots show median +/− IQR in the style of Tukey.
Fig. 4:
Fig. 4:. Colitis is more severe in mice colonized with microbiomes from humans with elevated serum CRP.
(A) Principal component analysis of median EAE, arthritis and colitis severities of all microbiomes from each disease group (Euclidian distances). (B) Principal component analysis of FDA-approved immune therapeutic targets for each disease group (Jaccard). (C), Correlation between microbiome donor serum CRP and colitis severity and groups of mice colonized with microbiome from those donors. (D), Serum hsCRP values in a cohort of healthy subjects, including some with low-grade inflammation. (E), Colitis severity (as measured by loss in body mass) in mice colonized with microbiomes from healthy humans with or without low-grade inflammation. (F), The relationship between microbiome donor serum hsCRP and colitis severity in groups of mice colonized with microbiomes from those donors. Mean +/− SEM from groups of mice and mean hsCRP (where multiple values are available) are shown. r values show Pearson correlation coefficients. Panels E and F include data from 13 microbiomes assayed in a total of 78 mice.

References

    1. Danesh J et al. Low grade inflammation and coronary heart disease: prospective study and updated meta-analyses. BMJ 321, 199 (2000). - PMC - PubMed
    1. Dehghan A. et al. Risk of Type 2 Diabetes Attributable to C-Reactive Protein and Other Risk Factors. Diabetes Care 30, 2695–2699 (2007). - PubMed
    1. Berger E. et al. Association between low-grade inflammation and Breast cancer and B-cell Myeloma and Non-Hodgkin Lymphoma: findings from two prospective cohorts. Scientific Reports 8, 10805 (2018). - PMC - PubMed
    1. Eaden J. A., Abrams K. R., Mayberry J. F., The risk of colorectal cancer in ulcerative colitis: a meta-analysis. Gut 48, 526 (2001). - PMC - PubMed
    1. Thompson K. N. et al. Alterations in the gut microbiome implicate key taxa and metabolic pathways across inflammatory arthritis phenotypes. Science translational medicine 15, eabn4722 (2023). - PubMed

Publication types