This is a preprint.
Self-organized and self-sustained ensemble activity patterns in simulation of mouse primary motor cortex
- PMID: 39868170
- PMCID: PMC11760730
- DOI: 10.1101/2025.01.13.632866
Self-organized and self-sustained ensemble activity patterns in simulation of mouse primary motor cortex
Abstract
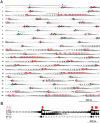
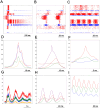
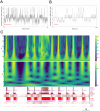
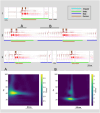
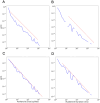
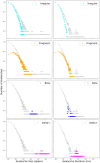
The idea of self-organized signal processing in the cerebral cortex has become a focus of research since Beggs and Plentz1 reported avalanches in local field potential recordings from organotypic cultures and acute slices of rat somatosensory cortex. How the cortex intrinsically organizes signals remains unknown. A current hypothesis was proposed by the condensed matter physicists Bak, Tang, and Wiesenfeld2 when they conjectured that if neuronal avalanche activity followed inverse power law distributions, then brain activity may be set around phase transitions within self-organized signals. We asked if we would observe self-organized signals in an isolated slice of our data driven detailed simulation of the mouse primary motor cortex? If we did, would we observe avalanches with power-law distributions in size and duration and what would they look like? Our results demonstrate that a brief unstructured stimulus (100ms, 57μA current) to a small subset of neurons (about 181 of more than 10,000) in a simulated mouse primary motor cortex slice results in self-organized and self-sustained avalanches with power-law size and duration distributions and values similar to those reported from in vivo and in vitro experiments. We observed 4 cross-layer and cross-neuron population patterns, 3 of which displayed a dominant rhythmic component. Avalanches were each composed of one or more of the 4 population patterns.
Conflict of interest statement
Potential Conflicts of Interest Nothing to report.
Figures
Similar articles
-
Avalanche Analysis from Multielectrode Ensemble Recordings in Cat, Monkey, and Human Cerebral Cortex during Wakefulness and Sleep.Front Physiol. 2012 Aug 3;3:302. doi: 10.3389/fphys.2012.00302. eCollection 2012. Front Physiol. 2012. PMID: 22934053 Free PMC article.
-
Multi-electrode array recordings of neuronal avalanches in organotypic cultures.J Vis Exp. 2011 Aug 1;(54):2949. doi: 10.3791/2949. J Vis Exp. 2011. PMID: 21841767 Free PMC article.
-
Can power-law scaling and neuronal avalanches arise from stochastic dynamics?PLoS One. 2010 Feb 11;5(2):e8982. doi: 10.1371/journal.pone.0008982. PLoS One. 2010. PMID: 20161798 Free PMC article.
-
Neural dynamics and information representation in microcircuits of motor cortex.Front Neural Circuits. 2013 May 3;7:85. doi: 10.3389/fncir.2013.00085. eCollection 2013. Front Neural Circuits. 2013. PMID: 23653596 Free PMC article. Review.
-
The mouse cerebellar cortex in organotypic slice cultures: an in vitro model to analyze the consequences of mutations and pathologies on neuronal survival, development, and function.Crit Rev Neurobiol. 2006;18(1-2):179-86. doi: 10.1615/critrevneurobiol.v18.i1-2.180. Crit Rev Neurobiol. 2006. PMID: 17725520 Review.
References
-
- Bak P., Tang C. & Wiesenfeld K. Self-organized criticality: An explanation of the 1/f noise. Phys. Rev. Lett. 59, 381–384 (1987). - PubMed
-
- Bruus H. & Flensberg K. Many-Body Quantum Theory in Condensed Matter Physics: An Introduction. (OUP Oxford, 2004).
Publication types
Grants and funding
LinkOut - more resources
Full Text Sources
