

This is a preprint.
Patterns of population structure and genetic variation within the Saudi Arabian population
- PMID: 39868174
- PMCID: PMC11761371
- DOI: 10.1101/2025.01.10.632500
Patterns of population structure and genetic variation within the Saudi Arabian population
Abstract
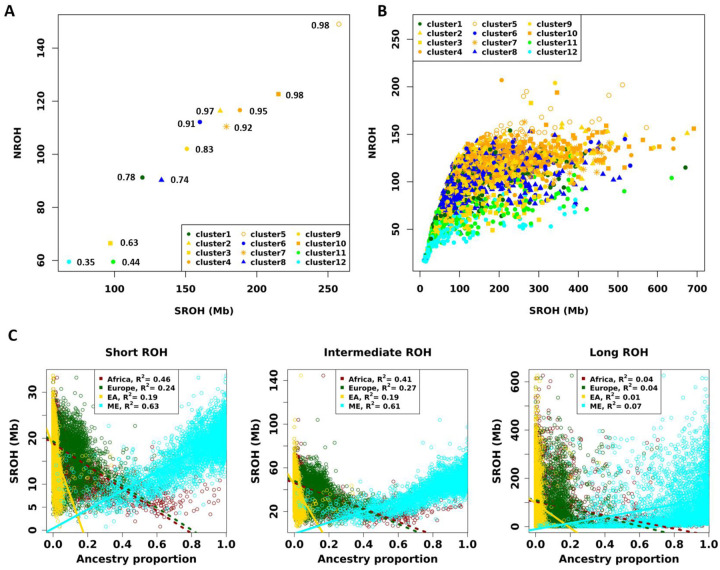
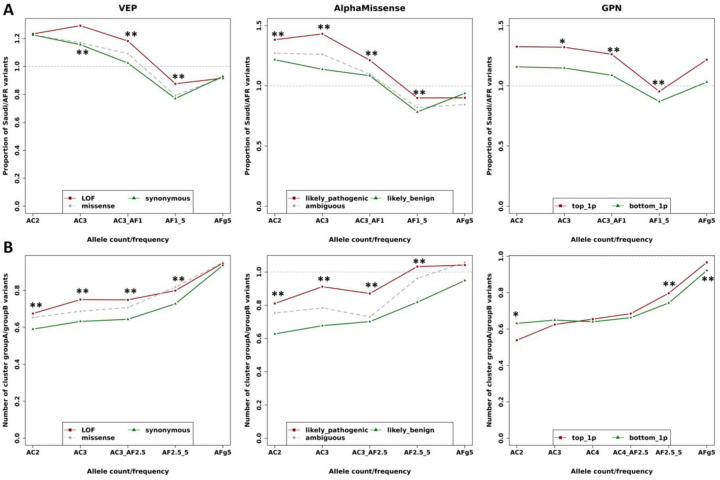
The Arabian Peninsula is considered the initial site of historic human migration out of Africa. The modern-day indigenous Arabians are believed to be the descendants who remained from the ancient split of the migrants into Eurasia. Here, we investigated how the population history and cultural practices such as endogamy have shaped the genetic variation of the Saudi Arabians. We genotyped 3,352 individuals and identified twelve genetic sub-clusters that corresponded to the geographical distribution of different tribal regions, differentiated by distinct components of ancestry based on comparisons to modern and ancient DNA references. These sub-clusters also showed variation across ranges of the genome covered in runs of homozygosity, as well as differences in population size changes over time. Using 25,488,981 variants found in whole genome sequencing data (WGS) from 302 individuals, we found that the Saudi tend to show proportionally more deleterious alleles than neutral alleles when compared to Africans/African Americans from gnomAD (e.g. a 13% increase of deleterious alleles annotated by AlphaMissense between 0.5 - 5% frequency in Saudi, compared to 7% decrease of the benign alleles; P < 0.001). Saudi sub-clusters with greater inbreeding and lower effective population sizes showed greater enrichment of deleterious alleles as well. Additionally, we found that approximately 10% of the variants discovered in our WGS data are not observed in gnomAD; these variants are also enriched with deleterious annotations. To accelerate studying the population-enriched deleterious alleles and their health consequences in this population, we made available the allele frequency estimates of 25,488,981 variants discovered in our samples. Taken together, our results suggest that Saudi's population history impacts its pattern of genetic variation with potential consequences to the population health. It further highlights the need to sequence diverse and unique populations so to provide a foundation on which to interpret medical- and pharmaco- genomic findings from these populations.
Conflict of interest statement
DECLARATION OF INTERESTS The authors declare no competing interests.
Figures


Similar articles
-
Genome at juncture of early human migration: a systematic analysis of two whole genomes and thirteen exomes from Kuwaiti population subgroup of inferred Saudi Arabian tribe ancestry.PLoS One. 2014 Jun 4;9(6):e99069. doi: 10.1371/journal.pone.0099069. eCollection 2014. PLoS One. 2014. PMID: 24896259 Free PMC article.
-
The type of bottleneck matters: Insights into the deleterious variation landscape of small managed populations.Evol Appl. 2019 Sep 30;13(2):330-341. doi: 10.1111/eva.12872. eCollection 2020 Feb. Evol Appl. 2019. PMID: 31993080 Free PMC article.
-
Massively parallel sequencing of autosomal STRs and identity-informative SNPs highlights consanguinity in Saudi Arabia.Forensic Sci Int Genet. 2019 Nov;43:102164. doi: 10.1016/j.fsigen.2019.102164. Epub 2019 Sep 22. Forensic Sci Int Genet. 2019. PMID: 31585345
-
Runs of homozygosity: current knowledge and applications in livestock.Anim Genet. 2017 Jun;48(3):255-271. doi: 10.1111/age.12526. Epub 2016 Dec 1. Anim Genet. 2017. PMID: 27910110 Review.
-
Craniometric variation, genetic theory, and modern human origins.Am J Phys Anthropol. 1994 Nov;95(3):249-70. doi: 10.1002/ajpa.1330950302. Am J Phys Anthropol. 1994. PMID: 7856764 Review.
References
-
- Henn B.M., Cavalli-Sforza L.L., and Feldman M.W. (2012). The great human expansion. Preprint, https://doi.org/10.1073/pnas.1212380109 10.1073/pnas.1212380109. - DOI - PMC - PubMed
-
- Rodriguez-Flores J.L., Fakhro K., Agosto-Perez F., Ramstetter M.D., Arbiza L., Vincent T.L., Robay A., Malek J.A., Suhre K., Chouchane L., et al. (2016). Indigenous Arabs are descendants of the earliest split from ancient Eurasian populations. Genome Res 26, 151–162. 10.1101/gr.191478.115. - DOI - PMC - PubMed
-
- Fernandes V., Alshamali F., Alves M., Costa M.D., Pereira J.B., Silva N.M., Cherni L., Harich N., Cerny V., Soares P., et al. (2012). The Arabian cradle: Mitochondrial relicts of the first steps along the Southern route out of Africa. Am J Hum Genet 90, 347–355. 10.1016/j.ajhg.2011.12.010. - DOI - PMC - PubMed
Publication types
Grants and funding
LinkOut - more resources
Full Text Sources