[Preprint]. 2025 Jan 13:2025.01.13.632555.
doi: 10.1101/2025.01.13.632555.

Development of FAP-targeted theranostics discovered by next-generation sequencing-augmented mining of a novel immunized VNAR library

Affiliations

Development of FAP-targeted theranostics discovered by next-generation sequencing-augmented mining of a novel immunized VNAR library

Gihan S Gunaratne et al. bioRxiv. .

Abstract

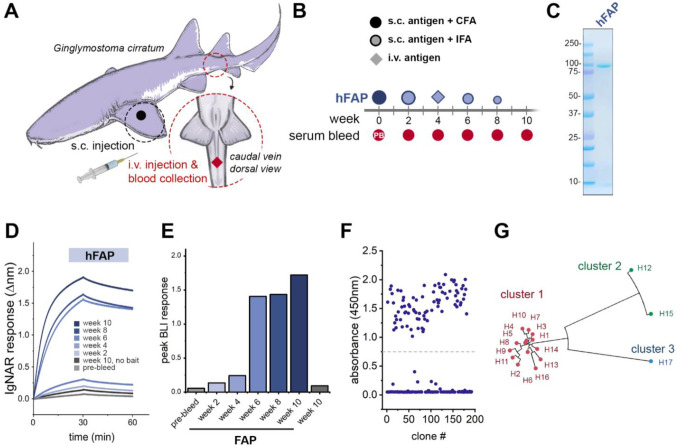
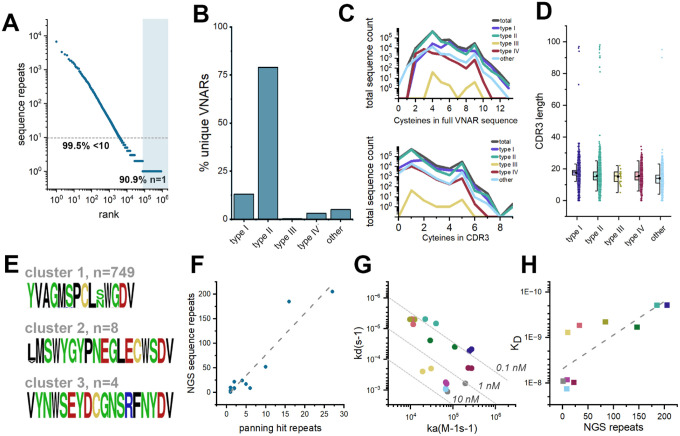
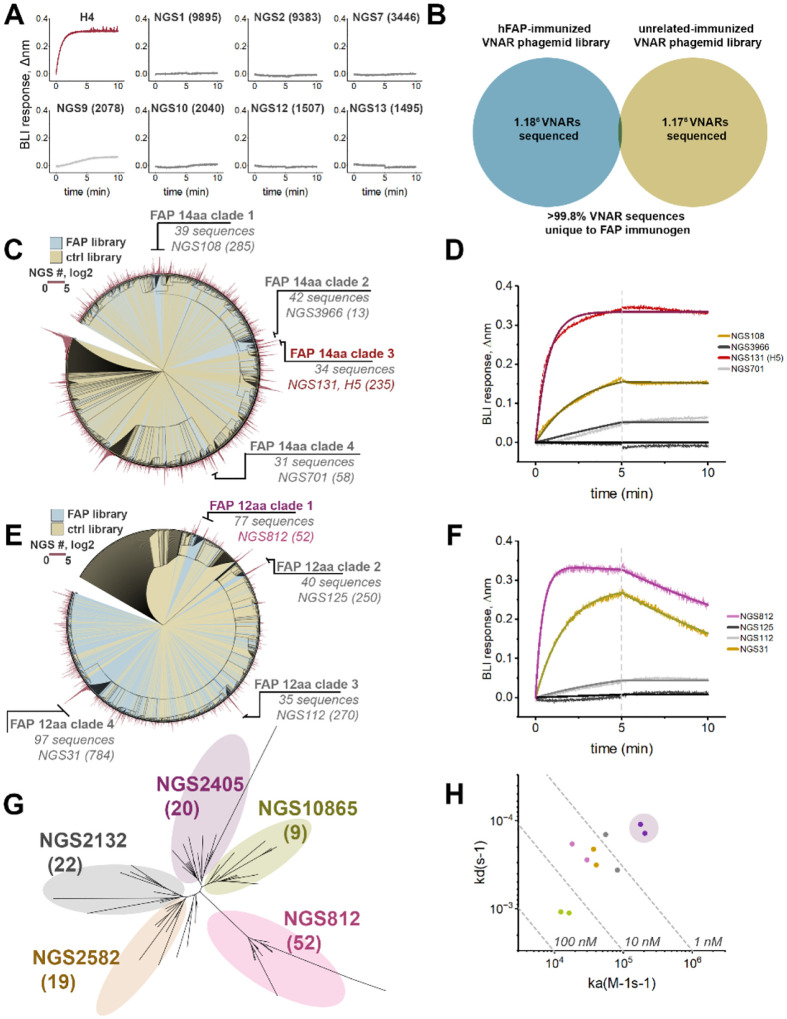
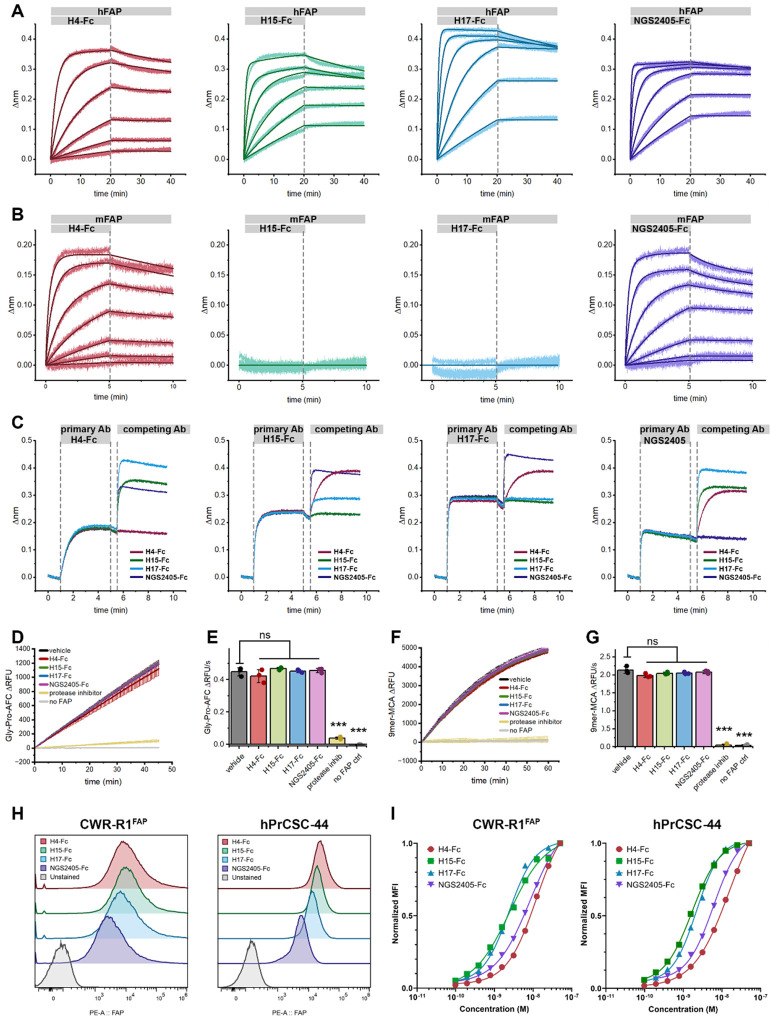
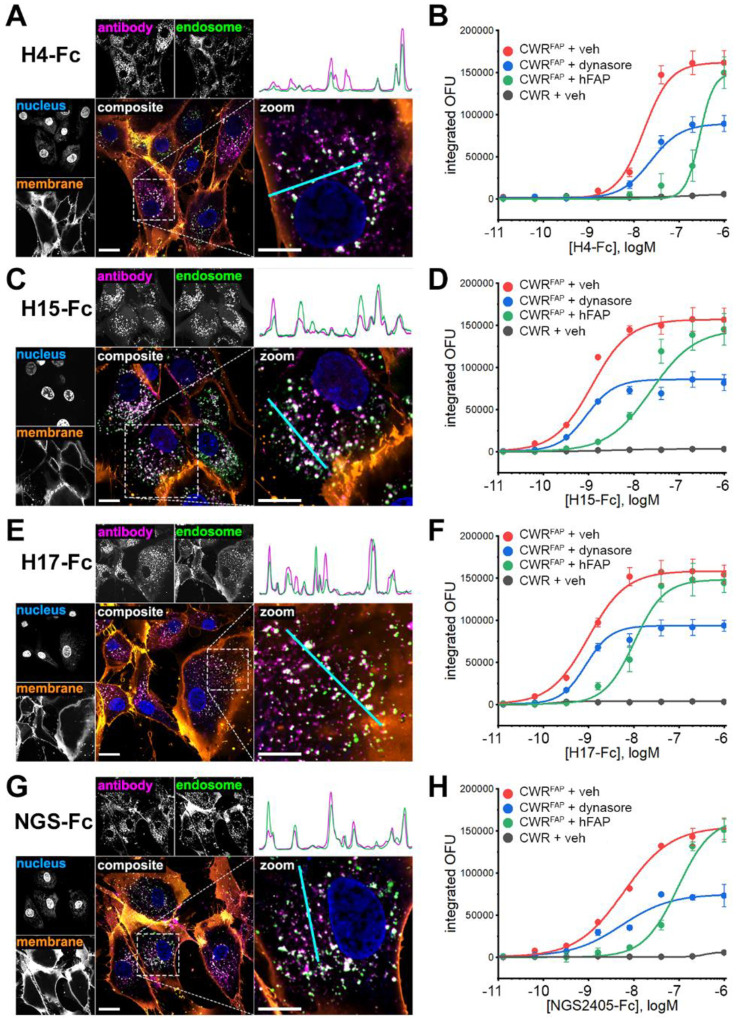
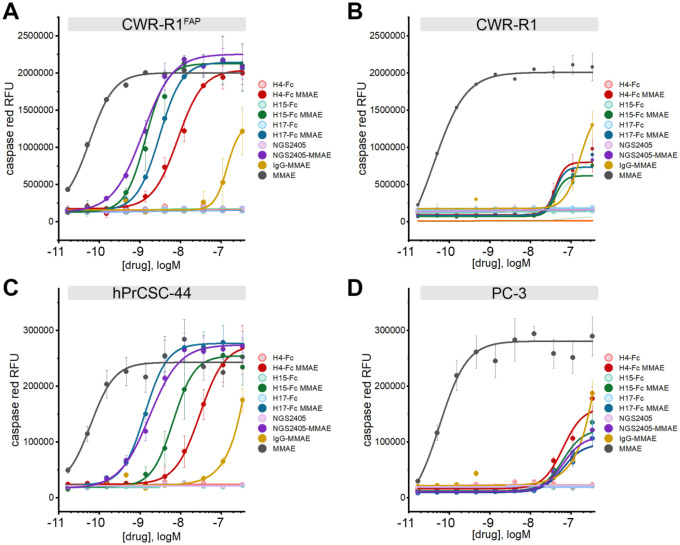
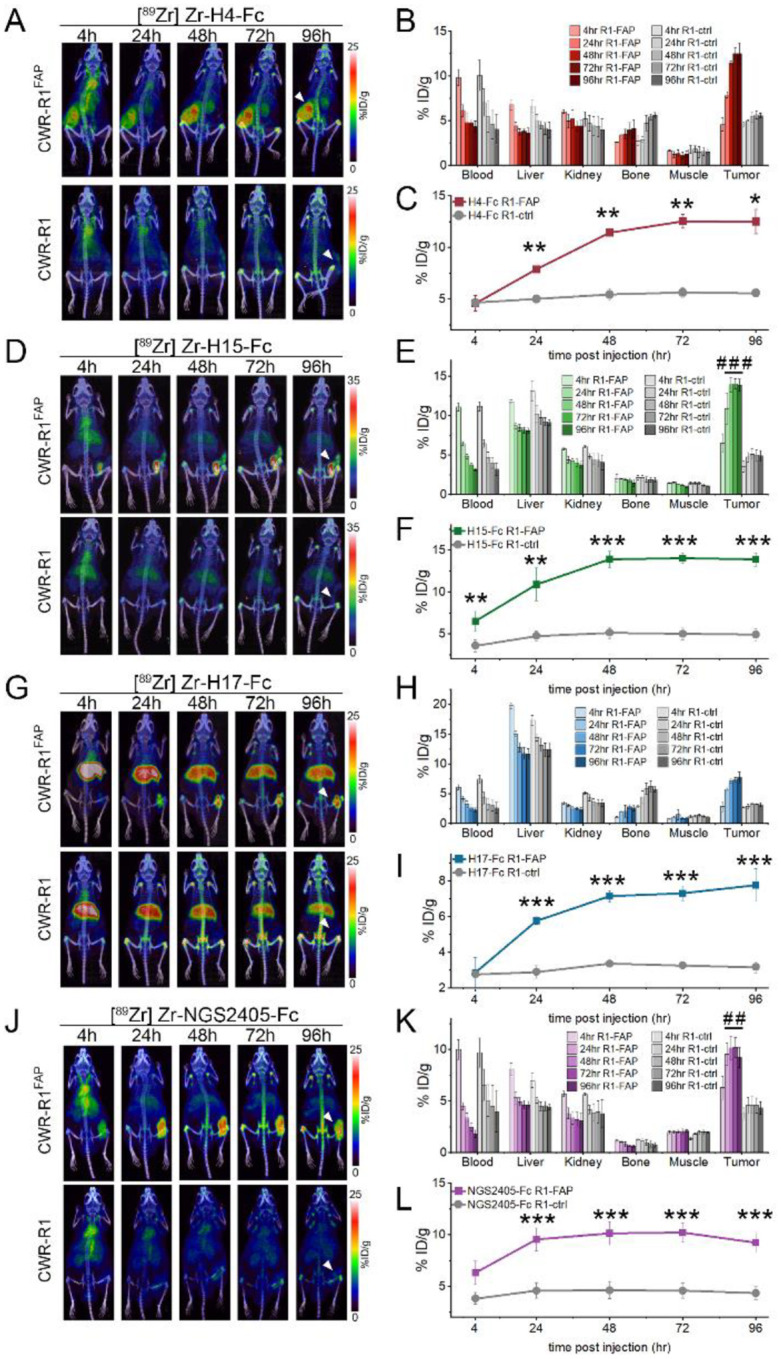
Cancer-associated fibroblasts (CAFs) in the stroma of solid tumors promote an immunosuppressive tumor microenvironment (TME) that drives resistance to therapies. The expression of the protease fibroblast activation protein (FAP) on the surface of CAFs has made FAP a target for development of therapies to dampen immunosuppression. Relatively few biologics have been developed for FAP and none have been developed that exploit the unique engagement properties of Variable New Antigen Receptors (VNARs) from shark antibodies. As the smallest binding domain in nature, VNARs cleverage unique geometries and recognize epitopes conventional antibodies cannot. By directly immunizing a nurse shark with FAP, we created a large anti-FAP VNAR phage display library. This library allowed us to identify a suite of anti-FAP VNARs through traditional biopanning and also by an in silico approach that did not require any prior affinity-based enrichment in vitro. We investigated four VNAR-Fc fusion proteins for theranostic properties and found that all four recognized FAP with high affinity and were rapidly internalized by FAP-positive cells. As a result, the VNAR-Fc constructs were effective antibody-drug conjugates in vitro and were able to localize to FAP-positive xenografts in vivo. Our findings establish VNAR-Fc constructs as a versatile platform for theranostic development that could yield innovative cancer therapies targeting the TME.


Figures

Figure 1.
Figure 1.. Immunization of a live nurse shark and identification of anti-FAP VNARs.
A) Schematic of sites used for subcutaneous (s.c.) or intravenous (i.v.) delivery of immunogens and blood collection. B) Illustration of the time course, injection sites, adjuvants used, and blood sample collection schedule throughout the FAP immunization program. C) SDS-PAGE and Coomassie staining of purified recombinant human FAP (hFAP) protein used for immunization. D) Biolayer interferometry (BLI) sensorgram from a representative experiment demonstrating the mobilization of an anti-FAP immune response after hFAP immunization. Diluted plasma samples (1:200) collected from the indicated time points were screened against biosensors loaded with immobilized hFAP for the presence of convalescent anti-hFAP IgNARs. Control sensors were exposed to plasma from week 10 in the absence of hFAP ligand. E) Quantification of convalescent anti-FAP IgNAR response in the indicated time points, data represents peak Δnm after 30min of dissociation. F) 196 clones were screened by ELISA for the production of anti-hFAP VNARs after a single round of biopanning by phage display. A threshold absorbance (OD450nm) of 0.75 was used for the identification of positive clones. G) Unrooted phylogenetic tree illustrating the relative sequence homology of positive anti-FAP VNAR clones, sequences sharing >90% sequence homology are depicted with the same color.
Figure 2.
Figure 2.. Next generation sequencing of hFAP-immunized phagemid library and validation of anti-FAP VNARs.
A) hFAP-immunized VNAR phagemid library was analyzed by MiSeq, sequences were ranked based on the prevalence of repeats. Scatter plot represents the rank-ordered distribution of sequence repeats, shown on a log-scale. Dashed line and shaded region indicate clones that are present in the sequencing dataset less than 10 times (99.5%) or a single time (90.9%), respectively. B) VNAR subtype distribution among all unique sequences. C) Prevalence of cysteine residues in unique full length VNAR sequences (top) or CDR3s of unique VNARs (bottom), per VNAR subtype. D) Number of amino acids in the CDR3 of VNARs by subtype. Data is presented as a column scatter, overlaid with a box plot reporting 25–75% percentile (box), mean (closed circle), and median (line). E) Sequence logos of the CDR3s of unique VNAR clones present in NGS dataset and share >90% sequence homology with hit anti-FAP VNARs identified by phage display. Polar amino acids (GSTYQN) are green; basic amino acids (KRH) are blue; acidic amino acids (DE) are red; hydrophobic amino acids (AVLIPWFM) are black; cysteines (C) are yellow. F) Pearson correlation of the number of sequence repeats per clone, detected by Sanger sequencing of hit clones after phagemid biopanning versus the number of identical sequences detected by NGS of the phagemid library. G) Isoaffinity plot of all 10 anti-FAP VNAR clones from biopanning clade 1 which were also detected by NGS. Data points are color coded by clone ID. H) Pearson correlation of the number of sequence repeats detected by NGS versus the measured affinity of 10 anti-FAP VNAR clones.
Figure 3.
Figure 3.. Identification of novel anti-FAP VNAR clones using NGS datasets.
A) The top 7 most prevalent VNAR sequences with unique CDR3s were screened for anti-hFAP binding by BLI, anti-FAP VNAR H4 was used as a positive control. Clone IDs represent the sequence ‘rank’ as described in Figure 2A, with the number of sequence repeats shown in parentheses. B) Venn diagram of sequence overlap between NGS dataset derived from sequencing of FAP-immunized VNAR phagemid library compared to a VNAR phagemid library immunized against a discrete unrelated immunogen. C) Circular phylogenetic tree of the top 2000 most prevalent 14-residue long CDR3s from the FAP-immunized NGS dataset (blue) and control dataset (yellow), overlaid with a circularized bar graph (red) representing the number of sequence repeats for each node. Clades with ≥30 unique sequences are shown, along with the most prevalent clone ID and the number of sequencing repeats. D) BLI sensorgram of experiment screening the most prevalent VNAR (500nM) from each clade in (C) against biosensors with immobilized hFAP. E) Circular phylogenetic tree of the top 2000 most prevalent 12-residue long CDR3s from the FAP-immunized NGS dataset (blue) and control dataset (yellow), overlaid with a circularized bar graph (red) representing the number of sequence repeats for each node. Clades with ≥30 unique sequences are shown, along with the most prevalent clone ID and the number of sequencing repeats. F) BLI sensorgram of experiment screening the most prevalent VNAR (500nM) from each clade in (E) against biosensors with immobilized hFAP. G) Unrooted phylogenetic tree of all unique sequences in the FAP-immunized phagemid library NGS dataset with a CDR3 length of 12aa and >90% CDR3 homology compared to clone NGS812. Distinct clusters are color coded with most prevalent clone within each cluster shown, along with the number of repeats in the NGS dataset. H) Iso-affinity plot of putative anti-FAP VNARs identified in (G). The most prevalent VNAR sequence from each cluster in (G) was screened against hFAP by BLI. The highest affinity clone, NGS2405, is depicted with purple shading.
Figure 4.
Figure 4.. In vitro characterization of lead anti-FAP VNAR-Fc constructs.
A-B) BLI sensorgrams of sensors loaded with hFAP (A) or mFAP (B), and monitored during exposure to serially diluted antibody analytes (300nM-0.412nM), followed by dissociation in assay buffer. Data represents raw BLI responses (thin lines) and fitted curves (bold lines) from a representative experiment. C) BLI sensorgrams from antibody cross-competition epitope binning experiments, wherein biosensors loaded with hFAP are exposed to a saturating concentration (1μM) of the indicated primary antibody, followed by exposure to a competing secondary antibody (1μM). D-G) kinetic traces (D, F) and cumulative quantification (E, G) of proteolytic activity of recombinant hFAP (0.3nM) in the presence of the indicated VNAR-Fc (1μM) using 1μM of either Ac-Gly-Pro-AFC (D-E) or MCA-Glu-Arg-Gly-Glu-Thr-Gly-Pro-Ser-Gly-Dnp (‘9mer’, F-G) fluorogenic substrates. H) Validation of membrane bound FAP expression in R1-CWRFAP and hPrCSC-44 cell lines by flow cytometry. Cells were stained using a fixed concentration of VNAR-Fc (50nM) and detected using a anti-IgG1-phycoerythrin secondary (5μg/mL). Samples were compared to an unstained cell control. I) Dose response curves of R1-CWRFAP and hPrCSC-44 cell lines using several staining concentrations of VNAR-Fc antibodies assessed by flow cytometry. p-values, ***p ≤ 0.001 compared to vehicle control using Student’s t-test.
Figure 5.
Figure 5.. Anti-FAP VNAR-Fc constructs internalize into FAP-expressing cells.
A,C,E,G, confocal microscopy images of hPrCSC-44 cells after incubation with H4-Fc-AF647 (A), H15-Fc-AF647 (C), H17-Fc-AF647 (E) or NGS2405-Fc-AF647 (G) for 1hr, using 10nM of anti-FAP VNAR-Fc-AF647 and 50μg/ml of fluorescein-dextran. Single-channel images of VNAR-Fc-AF647 localization, fluorescein-labeled endosomes, Hoescht 33342-labeled nuclei, and CellBrite 555-labeled membranes are shown. Merged composite images depicting whole-cells and enlarged regions of interest are shown as colored fluorescence overlays. Top right, plots of relative fluorescent signal detected in line scans (teal) in the antibody channel and the endosome channel are shown to illustrate spatial co-localization of punctate structures. Scale bar represents 20μm in uncropped images, and 10μm in zoomed insets. B, D, F, H, aggregate data from high-content live-cell imaging of anti-FAP VNAR-Fc internalization into CWR-R1FAP or CWR-R1 cells. Antibodies were directly labeled with pHrodoRed, integrated pHrodoRed fluorescence detected after treatment with the indicated concentration of H4-Fc-pHrodoRed (B), H15-Fc-pHrodoRed (D), H17-Fc-pHrodoRed (F), or NGS2405-Fc-pHrodoRed (H) in CWR-R1 cells or CWR-R1FAP cells that were either treated with DMSO vehicle (0.1%), dynasore (30μM), or 100nM of soluble recombinant hFAP. Data represents mean ± s.e.m. from n=3 independent experiments.
Figure 6.
Figure 6.. In vitro cytotoxicity of anti-FAP VNAR-Fc-MMAE antibody-drug conjugates.
Anti-FAP VNAR-Fcs site-specifically conjugated to a monomethyl auristatin E (MMAE) payload were tested for induction of caspase 3/7 activity, as detected using a fluorogenic caspase 3/7 substrate (NucView555) in high-content live-cell imaging experiments. Assays were conducted in parallel with parental unconjugated VNAR-Fc, a non-targeting isotype control VNAR-Fc-MMAE, and free MMAE drug in A) FAP-positive CWR-R1FAP cells, B) FAP-negative parental CWR-R1 cells, C) FAP-positive hPrCSC-44 CAF cells, and D) FAP-negative PC-3 cells. Data represents mean ± s.e.m. values from n=3 independent experiments.
Figure 7.
Figure 7.. PET/CT imaging of FAP-expressing xenografts in vivo.
Representative images from PET/CT scans of A) [89Zr]Zr-H4-Fc, D) [89Zr]Zr-H15-Fc, G) [89Zr]Zr-H17-Fc, and J) 89Zr]Zr-NGS2405-Fc localization in mice bearing CWR-R1FAP (top) or CWR-R1 (bottom) xenografts at the indicated time points. Biodistribution among the indicated organs at the indicated time points in mice bearing either CWR-R1-EnzRFAP or CWR-R1-EnzR prostate cancer xenografts for B) [Zr89]Zr-H4-Fc, E) [Zr89]Zr-H15-Fc, H) [Zr89]Zr-H17-Fc, and K) [Zr89]Zr-NGS2405-Fc. Quantitative analysis of C) [Zr89]Zr-H4-Fc, F) [Zr89]Zr-H15-Fc, I) [Zr89]Zr-H17-Fc, and L) [Zr89]Zr-NGS2405-Fc uptake in CWR-R1FAP or CWR-R1 subcutaneous xenografts. Radiolabeled antibodies were delivered via tail vein injection in n=3 mice per condition, p values, * p ≤ 0.05; ** p ≤ 0.01, *** p ≤ 0.001 compared to FAP-negative controls. ##p ≤ 0.01; ###p ≤ 0.001 compared to all secondary organs at the same time point.

Similar articles

References

    1. Tormoen G.W., Crittenden M.R. & Gough M.J. Role of the immunosuppressive microenvironment in immunotherapy. Adv Radiat Oncol 3, 520–526 (2018). - PMC - PubMed
    1. Tie Y., Tang F., Wei Y.Q. & Wei X.W. Immunosuppressive cells in cancer: mechanisms and potential therapeutic targets. J Hematol Oncol 15, 61 (2022). - PMC - PubMed
    1. Tiwari A., Trivedi R. & Lin S.Y. Tumor microenvironment: barrier or opportunity towards effective cancer therapy. J Biomed Sci 29, 83 (2022). - PMC - PubMed
    1. Taylor R.A. & Risbridger G.P. Prostatic tumor stroma: a key player in cancer progression. Curr Cancer Drug Targets 8, 490–497 (2008). - PubMed
    1. Glabman R.A., Choyke P.L. & Sato N. Cancer-Associated Fibroblasts: Tumorigenicity and Targeting for Cancer Therapy. Cancers (Basel) 14(2022). - PMC - PubMed

Publication types