[Preprint]. 2025 Jan 15:2025.01.15.632531.
doi: 10.1101/2025.01.15.632531.

Keratin intermediate filaments mechanically position melanin pigments for genome photoprotection

Affiliations

Keratin intermediate filaments mechanically position melanin pigments for genome photoprotection

Silvia Benito-Martínez et al. bioRxiv. .

Abstract

Melanin pigments block genotoxic agents by positioning on the sun-exposed side of human skin keratinocytes' nucleus. How this position is regulated and its role in genome photoprotection remains unknown. By developing a model of human keratinocytes internalizing extracellular melanin into pigment organelles, we show that keratin 5/14 intermediate filaments mechanically control the 3D perinuclear position of pigments, shielding DNA from photodamage. Imaging and microrheology in human disease-related model identify structural keratin cages surrounding pigment organelles to stiffen their microenvironment and maintain their 3D position. Optimum pigment spatialization is required for DNA photoprotection and rely on the interplay between intermediate filaments and microtubules bridged by plectin cytolinkers. Thus, the mechanically-driven proximity of pigment organelles to the nucleus is a key photoprotective parameter. Uncovering how human skin counteracts solar radiation by positioning the melanin microparasol next to the genome anticipates that dynamic spatialization of organelles is a physiological UV stress response.

Keywords: intermediate filaments; keratinocyte; keratins; melanin; microtubules; organelle distribution; skin pigmentation and photoprotection.


Conflict of interest statement

Competing Interest The authors declare a competing interest. Marion Plessis, Charlène Gayrard, Françoise Bernerd and Christine Duval are full time employees of L’Oreal Research and Innovation, which also provided a financial support through a research contract agreement with Structure and Membrane Compartments’s team, Institut Curie, PSL Research University, CNRS, UMR144, 75005 Paris, France.

Figures

Extended Data Figure 1.
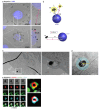
Extended Data Figure 1.. Collection and automatic optical detection of melanocores.
(a) Steps illustrating the procedure for isolating MCs from MNT-1 cell culture medium collected and deposited in a column containing a porous filter (1), then centrifuged (2) to retain pigmented MCs in a pocket (3, arrow) followed by content transfer to a tube and centrifugation to form a pigmented MCs pellet (4). (b) Quantification of the average estimated melanin concentration of MCs-enriched fractions. (c) EM micrographs of MCs isolated from primary highly pigmented HEM cell culture medium. Arrowheads point to lipid vesicles associated to MC. (d) Quantification of the maximum intensity of the inverted signal captured by brightfield illumination of individual MCs as a function of their maximum intensity of the fluorescent signal for HMB45 (n=255 MCs). (e-f) IFM of isolated MCs captured by brightfield illumination (e, top) and stained with HMB45 antibody (f, top; red). HMB45+ and lighter MCs (e, bottom, arrowheads) not identified by automatic detection of MCs based on the brightfield image were subsequently identified using automatic detection of HMB45 signal (f, bottom, arrowheads). Automatically detected MCs are circled in yellow. Data are the average of at least three independent experiments presented as the mean ± SEM.
Extended Data Figure 2.
Extended Data Figure 2.. Position of melanocores organelles relative to nucleus and molecular composition.
(a) IFM of HEKs 10 min (top) or 7-days (bottom) after MCs (arrowheads) deposition and DAPI staining (blue). Automatically detected MCs are circled in yellow and distance (d in insets) of individual MC to nucleus edge (dashed line in insets) is depicted in magenta. (b) Diagram showing the automatic measurement (by code2) of the total distance (D; double black arrow) from each MC (yellow circles) to the center of mass of the nucleus (blue ball). Further subtraction of the nuclear radius (r) from D gives the estimated 2D distance (d; magenta double arrow) from individual MC to the nuclear membrane (NM, dashed black line). (c) Conventional EM micrographs of ultrathin sections of HEKs 30 min after MC deposition. Arrowheads point to an extracellular MC affixed to plasma membrane (arrow) forming finger-like protrusion (inset, arrow). (d) Conventional EM micrograph of ultrathin section of HEKs 1-day after MC deposition depicting the area used for analysis in Fig. 2d. (e) SR-IFM of HEKs 1-day after MCs deposition and stained with HMB45 (red), anti-LAMP1 (green) and −CD63 (cyan) antibodies. Insets (left) are consecutive z-stacks of the same MC+ organelle.
Extended Data Figure 3.
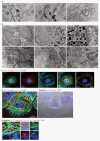
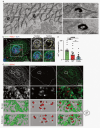
Extended Data Figure 3.. Melanocore organelles in keratinocytes are partially surrounded by keratin intermediate filaments in vitro and in vivo.
(a) Conventional EM micrographs of ultrathin sections of HEKs from light (left, middle) or dark (right) skin donors 1 day after MC deposition. Arrowheads point to keratin+ intermediate filaments surrounding MC+ organelles (arrows). (b) Conventional EM micrographs of ultrathin sections of human pigmented skins from dark (top) or light (bottom) skin donors showing keratin+ intermediate filaments (arrowheads) surrounding MC+ organelles in epidermal keratinocytes. Middle panels are magnified area of the boxed regions. (c) IFM of HEKs stained with anti-KRT5 (green) and -α-tubulin (red) antibodies, fluorescence-conjugated phalloidin (cyan), and DAPI (blue). Monochrome and merged images are shown in addition to the outer contour delineation of the different cytoskeletal staining (dashed lines, right). (d-e) IFM of HEKs 1-day after MCs deposition (d) and stained as in (c) highlighting perinuclear MC+ organelles (captured by brightfield and pseudocolored in magenta) in. Automatically detected MCs are circled in yellow (e).
Extended Data Figure 4.
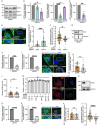
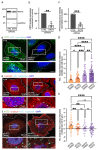
Extended Data Figure 4.. Keratin 14 controls the 3D-position of melanocore organelles, while plectin 1 contributes to their vertical positioning.
(a) Western blot of HEK lysates treated with control (CTRL), keratin 14 (KRT14) or keratin 5 (KRT5) siRNAs and probed with anti-KRT14 (top), -KRT5 (middle) or -GAPDH (loading control, bottom) antibodies. (b) Quantification of the average expression levels of KRT14 (left) or KRT5 (right) in siRNA-treated HEKs (as in a) normalized to GAPDH levels and control. (c) Average fluorescence intensity of KRT14 in siCTRL- or siKRT14-treated HEKs analyzed in Fig. 4e–f and normalized to control. (d) IFM of siCTRL- (left) or siKRT14- (right) treated HEKs stained with anti-KRT14 antibody (green) and DAPI (blue). (e) Quantification of the median distance of MC+ organelles to the nucleus edge in siCTRL- or siKRT14-treated HEKs expressed per cell. (f) Quantification of the median distance of MC+ organelles from nucleus mid-plane expressed per cell. (g) Western blot of HEK lysates treated with CTRL or vimentin (VIM) siRNAs and probed for VIM (top) or GAPDH (loading control, bottom). (h) Quantification of the average expression level of VIM in siCTRL- or siVIM-treated HEKs normalized to GAPDH levels and control. (i) Quantification of the mean VIM fluorescence intensity in siCTRL- or siVIM-treated HEKs used for analysis in Extended Data Fig. 4j–k and normalized to control. (j) IFM of siCTRL- (left) or siVIM- (right) treated HEKs stained with anti-VIM antibody (green) and DAPI (blue). (k) Quantification of the median distance of MC+ organelles to the nucleus edge in siCTRL- or siVIM-treated HEKs expressed per experiment. (l) Quantification of the number of MC+ organelles in siCTRL- and siVIM-treated HEKs analyzed in (k). (m) Quantification of the mean radius of the nucleus in HEKs treated with CTRL, KRT5, KRT14, VIM or PLEC1 siRNAs and incubated or not with DMSO or nocodazole. (n) IFM of DMSO- or nocodazole-treated HEKs stained with anti-α-tubulin (red) and -TGN46 (green) antibodies, and DAPI (blue). (o) Western blot of HEK lysates treated with CTRL or plectin 1 (PLEC1) siRNAs and probed for anti-PLEC1 (top) or -GAPDH (loading control, bottom) antibodies. (p) Quantification of the average expression level of PLEC1 in siCTRL- or siPLEC1-treated HEKs normalized to GAPDH levels and control. (q) Quantification of the mean PLEC1 fluorescence intensity in siCTRL- or siPLEC1-treated HEKs used for analysis (Extended Data Fig. 4r–t) and normalized to control. (r) IFM of siCTRL- (left) or siPLEC1- (right) treated HEKs stained with anti-PLEC1 antibody (green) and DAPI (blue). (s) Quantification of the median distance of MC+ organelles to the nucleus edge in siCTRL- or siPLEC1-treated HEKs expressed per cell. (t) Quantification of the median distance of MC+ organelles from nucleus mid-plane expressed per cell. (d, j, n, r) Cell outlines are delineated by dashed lines. (d, j, r) Automatically detected MCs captured 1-day after deposition by brightfield microscopy were pseudo-colored in cyan and circled in yellow. Data are the average of at least three independent experiments presented as the mean or median ± SEM. Two-tailed unpaired t test and one-way ANOVA with Tukey post-hoc (ns, non-significant; **, P < 0.01; ***, P < 0.001; ****, P < 0.0001).
Extended Data Figure 5.
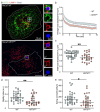
Extended Data Figure 5.. KRT5 expression is required for MC+ organelles perinuclear clustering and mechanical confinement.
(a) Western blot of lysates of WT and KRT5DDD HaCaT cells probed with anti-KRT14 (top), -KRT5 (middle) or -GAPDH (loading control, bottom) antibodies. (b) (Top) FM of nocodazole-treated KRT5DDD HaCaT cells expressing (right) or not (left) KRT5-mCherry (magenta) 1 day after MCs deposition and stained with DAPI (blue). MCs captured 1 day after deposition by brightfield microscopy were pseudo-colored in cyan Automatically detected MCs are circled in yellow and cell outlines are delineated by dashed lines. (Bottom) Quantification of the median distance of MC+ organelles to the nucleus edge expressed per cell. (c) (Top) Live imaging frame of WT- (left) or KRT5DDD- (right) HaCaT cells incubated with SiR-Tubulin probe (magenta). MC+ organelles (not shown) were captured by brightfield, and their movements tracked throughout >8min of acquisition. The trajectories (colored lines) of detected MC+ organelles are shown. Arrowheads point the trajectory of a MC+ organelle over 7min in HaCaT-KRT5DDD cells and its alignment along SiR-Tubulin+ MTs. (Bottom) Instantaneous speed in between time frames of tracked MC+ organelles in WT (cyan) or KRT5DDD (red) HaCaT cells and presented as a frequency plot. (d) Diagram illustrating the microrheology experiment. (Top) A 2-μm-diameter bead internalized in the cell is trapped with an optical tweezer. At time t = 0 s, the microscope stage is moved in a Xs = 0.5-μm step displacement. After the initial rapid displacement of the bead from the trap center, the bead position xb(t) relaxes towards the center of the optical trap, which acts as a spring. (Bottom left) Single particle tracking of the bead allows determination of the viscoelastic relaxation curves (see Fig. 5b). (Bottom right) Diagram of the Standard Linear Liquid (SLL) viscoelastic model. (e) IFM of WT (left) and KRT5DDD (right) HaCaT cells having internalized beads (blue) and stained with anti-LAMP1 (green) and -CD63 (red) antibodies. (f) IFM of WT HaCaT cell having internalized beads (blue) and stained with anti-KRT5 (green) and -LAMP1 (red) antibodies. Insets show several z optical sections of the boxed area. (f) Quantification of the relaxation curves in Fig. 5b using the Standard Linear Liquid (SLL) viscoelastic model and analysis of the viscosity (in Pa.s) of the cytosolic microenvironment of the bead in WT (blue) or KRT5DDD (red) HaCaT cells. (b, c, e, f) Cell outlines are delineated by dashed lines. Data are the average of at least three independent experiments presented as the mean ± SD or SEM. Two-tailed unpaired t test (b) and Mann-Whitney two-tailed unpaired t test (g) (ns, non-significant; *, P < 0.05).
Extended Data Figure 6.
Extended Data Figure 6.. Perinuclear melanocore organelles have photoprotective activity.
(a) Matrixes of correlation between the mean fluorescent nuclear intensities of CPD and HMB45 per HEK exposed to UVB doses of 0.5 J/cm2 (top) or 1 J/cm2 (bottom) analyzed in Fig. 6a–b and showing the non-parametric Spearman correlation coefficient (r). (b) IFM 1 day after MCs uptake of siCTRL-NOCO (left) or siKRT5-DMSO (right) treated HEKs exposed to 1 J/cm2 UVB dose before staining with anti-CPD antibody (green) and DAPI (cyan). MCs captured by brightfield microscopy were pseudo-colored in magenta. Cells are delineated by dashed lines. (c) Quantification of the mean number of MCs per cell treated in Fig. 6d. (d) Matrix of correlation between the mean nuclear CPD fluorescence intensity and the mean number of MCs per HEK analyzed in Figures 6 c–e and showing the non-parametric Spearman correlation coefficient (r). Data are the average of at least three independent experiments presented as the mean ± SEM. One-way ANOVA statistical analysis with Tukey post-hoc (ns, non-significant; ****, P < 0.0001).
Figure 1.
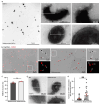
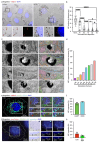
Figure 1.. Melanocores are the secreted luminal melanin content of intracellular melanosomes.
(a) EM micrographs of MCs isolated from MNT-1 cell culture medium showing pigmented particles ~500 nm in size lacking limiting membranes and associated with lipid vesicles (arrowheads). (b) IFM of isolated MCs (left) or melanosomes (right) stained with HMB45 antibody (red, arrowheads and arrows, respectively) that appear as dark spots by brightfield illumination. (c) Average percentage of HMB45+-MCs or -melanosomes as in (b). (d) Immunogold labelling by EM of isolated MCs (left) or melanosomes (right) stained with TYRP1 antibody (arrows). (e) Average number of TYRP1-associated gold particles per pigmented structures. Data are the average of at least three independent experiments presented as the mean ± SEM. Two-tailed unpaired t test (ns, non-significant; *, P < 0.05).
Figure 2.
Figure 2.. Internalized melanocores are perinuclearly positioned in lysosome-like organelles.
(a) IFM of HEKs 0 min (left) or 1-day (right) after MCs (arrowheads) deposition and staining with HMB45 antibody (red) and DAPI (blue). (b) Quantification of the distance (d in μm) of each automatically detected MC as in (a) to their nucleus edge as a function of time after deposition. (c) Conventional EM micrographs of ultrathin sections of HEKs at different time after MC deposition. Insets (left) show MCs in single-membrane compartments (arrowheads) in proximity to various subcellular structures (right): keratin intermediate filaments (KRT; green), endoplasmic reticulum (ER; orange), mitochondria (Mito; pink), Golgi apparatus (GA; yellow), nuclear membrane (NM; blue), tubulo-vesicles (TVM; light red), endomembrane organelles (Endo; grey). (d) Quantification of the percentage of MC+ organelles in the vicinity of the subcellular structures shown in (c) in addition to plasma membrane (PM; purple). (e) SR-IFM of HEKs 1-day after MCs deposition and stained with HMB45 (red), anti-LAMP1 (green) and -CD63 (cyan) antibodies, and DAPI (blue). (f) Quantification of the mean percentage of MC+ organelles (as in e) positive for LAMP1 or CD63. (g) IFM of HEKs incubated with LysoTracker (red) and DQ-BSA (green) probes 1-day after MCs deposition (captured in brightfield and pseudo-colored in cyan) and stained with DAPI (blue). (h) Quantification of the mean percentage of MC+ organelles (as in g) positive for LysoTracker or DQ-BSA. Data are the average of at least three independent experiments presented as the mean ± SEM. Two-tailed unpaired t test (ns, non-significant; *, P < 0.05; ***, P < 0.001; ****, P < 0.0001). Automatically detected MCs (insets; arrowheads) are circled in yellow and cell outlines delineated by dashed lines.
Figure 3.
Figure 3.. Melanocore organelles are surrounded by keratin 5 intermediate filaments in cage-like structures.
(a) Conventional EM micrographs of ultrathin sections of HEKs 1-day after MCs deposition. Arrows point to MC+ organelles encircled by keratin+ intermediate filaments, named keratin cages (arrowheads). Insets (right) show the same MC+ organelle and its keratin cage (arrowheads) at two different z-planes. (b) IFM of HEKs 1-day after MCs deposition stained with KRT5 (green) and HMB45 (red) antibodies, and DAPI (blue). Insets (right) show MC+ organelles (arrowheads) at two different z-planes, at the top (left) or middle (right) of the nucleus. (c) IFM of HEKs 1 day after MCs deposition stained with anti-KRT5 (green) and HMB45 (red) antibodies and processed for 3D surface rendering of the boxed area to highlight the 3D organization of HMB45+ MC+ organelles in close proximity with KRT5+ IFs (arrowheads). Top and bottom views of the same area are presented (see also Video 1). (d) Quantification of the mean percentage of MC+ organelle per cell positive for KRT5, α-tubulin, or F-Actin staining (see also Extended Data Fig. 3c–e). Data are the average of three independent experiments presented as the mean ± SEM. Mann-Whitney two-tailed unpaired t test (ns, non-significant; **, P < 0.01; ****, P < 0.0001; ns, non-significant). The cell outline is delineated by a dashed line.
Figure 4.
Figure 4.. 3D-position of melanocore organelles relies on KRT5+ intermediate filaments and microtubule network.
(a) Western blot of HEK lysates treated with control (CTRL) or keratin 5 (KRT5) siRNAs and probed for KRT5 (top) or GAPDH (loading control, bottom). (b) Quantification of the average expression level of KRT5 in siCTRL- and siKRT5-treated HEKs normalized to GAPDH levels and control. (c) Quantification of the average fluorescence intensity of KRT5 in siCTRL- or siKRT5-treated DMSO-incubated HEKs used for analysis in figure 4d and normalized to control. (d) IFM of siCTRL- (left) or siKRT5- (right) treated HEKs incubated with DMSO and stained with KRT5 antibody (green) and DAPI (blue). (e) IFM of siCTRL-treated HEKs incubated with DMSO (left) or nocodazole (right) and stained with α-tubulin (red) antibody and DAPI (blue). (f) IFM of siKRT5-treated HEKs incubated with DMSO (left) or nocodazole (right) and stained with anti-KRT5 (green) and -α-tubulin (red) antibodies and DAPI (blue). (g) Quantification of the median distance of MC+ organelles to the nucleus edge in siCTRL- or siKRT5-treated HEKs incubated with DMSO or nocodazole expressed per cell. (h) Quantification of the median distance of MC+ organelles from nucleus mid-plane in siCTRL- or siKRT5-treated HEKs incubated with DMSO or nocodazole expressed per cell. (d-f) MCs were captured 1 day after deposition by brightfield microscopy and pseudo-colored in cyan. Automatically detected MCs are circled in yellow and cell outlines are delineated by dashed lines. Data are the average of at least three independent experiments presented as the mean or median ± SEM. Two-tailed unpaired t test and one-way ANOVA with Tukey post-hoc (ns, non-significant; *, P < 0.05; **, P < 0.01).
Figure 5.
Figure 5.. The Dowling-Degos disease keratin 5 mutation decreases the stiffness of the cytosolic microenvironment.
(a) IFM of HaCaT cell wild-type (WT, top) or carrying the DDD-associated KRT5 mutation (KRT5DDD, bottom) having internalized 2-μm beads (blue) and stained with KRT5 (green) and LAMP1 (red) antibodies. Arrowheads (top, insets) point to KRT5 staining surrounding internalized bead in a WT cell, and arrows (bottom, insets) point to the absence of KRT5 signal in a KRT5DDD cell. Cell outlines are delineated by dashed lines. (b) Quantification of the average bead displacement (in μm) in WT (blue) or KRT5DDD (red) HaCaT cells as a function of time (in sec) showing viscoelastic relaxation of the bead towards the trap center following a 0.5 μm step displacement of the microscope stage. (c-d) Quantification of the relaxation curves (shown in b) using a phenomenological model approach giving the initial bead displacement (c; or bead-step amplitude, Xb in μm) and the rigidity index (d) in WT (blue) or KRT5DDD (red) HaCaT cells. (e) Quantification of the relaxation curves (shown in b) using the Standard Linear Liquid (SLL) viscoelastic model and analysis of the elasticity (spring constant in pN/μm) of the cytosolic microenvironment of the bead in WT (blue) or KRT5DDD (red) HaCaT cells. Data are the average of at least three independent experiments presented as the mean ± SD. Mann-Whitney two-tailed unpaired t test (*, P < 0.05; **, P < 0.01).
Figure 6.
Figure 6.. DNA photoprotection relies on melanocores organelles and their perinuclear 3D-position.
(a) IFM of HEKs with (bottom) or without (top) 1-day deposition of MCs exposed to a UVB dose of 0.5 J/cm2 (left) or 1 J/cm2 (right) before staining with CPD antibody (green) and DAPI (blue). MCs were captured by brightfield microscopy and nucleus outlines delineated by dashed lines. (b) Quantification of the mean nuclear CPD fluorescence intensity in cells treated as in (a) and normalized to respective controls. (c) IFM 1-day after MCs deposition of DMSO siCTRL- (left) or nocodazole siKRT5- (right) treated HEKs exposed with 1 J/cm2 UVB dose before staining with CPD (green) and DAPI (cyan). MCs captured by brightfield microscopy were pseudo-colored in magenta. Cell outlines are delineated by dashed lines. (d) Quantification of the mean nuclear CPD fluorescence intensity in cells treated as in (c) and normalized to control. (e) Matrix of correlation between the mean nuclear CPD fluorescence intensity and the mean MC organelle-nucleus median distance of siCTRL-DMSO and siKRT5-NOCO-treated HEKs and showing the non-parametric Spearman correlation coefficient (r). (f) Working model on the role of KRT5/14+ IFs (pink) in the perinuclear positioning of MC+ organelles and UVB-dependent DNA photoprotection in skin keratinocytes. (Left) Under normal conditions, extracellular MCs are internalized and stored in non-acidic and non-degradative MC+ organelles carrying CD63 and LAMP1 (yellow and blue, respectively) located in the perinuclear area atop the nucleus to form a melanin microparasol shielding DNA from UVB-dependent damages. There, MC+ organelles are surrounded by KRT5/14+ IFs in cage-like structures that mechanically maintain their 3D-proximity to the nucleus by rigidifying the cytosolic microenvironment, while microtubules (green) aid in their vertical positioning via plectin 1-dependent bridging to IFs (purple). (Right) Loss of KRT5 expression or presence of the Dowling-Degos disease (DDD)-associated KRT5 mutation leads to the dispersal of MC+ organelles due to cytosol softening and increased microtubule-dependent motility. Disrupting the microparasol by altering KRT5+ IFs and microtubules enhances the 3D-dispersion of MC+ organelles, resulting in more UVB-induced DNA photolesions (CPDs) showing suboptimal photoprotection of genetic material from UVB solar radiation. Data are the average of at least three independent experiments presented as the mean ± SEM. One-way ANOVA statistical analysis with Tukey post-hoc (ns, non-significant; **, P < 0.01; ***, P < 0.001; ****, P < 0.0001).

References

    1. Benito-Martinez S., Salavessa L., Raposo G., Marks M. S. & Delevoye C. Melanin Transfer and Fate within Keratinocytes in Human Skin Pigmentation. Integrative and comparative biology (2021) doi:10.1093/icb/icab094. - DOI - PMC - PubMed
    1. Bowman S. L., Bi-Karchin J., Le L. & Marks M. S. The road to LROs: insights into lysosome-related organelles from Hermansky-Pudlak syndrome and other rare diseases. Traffic (2019) doi:10.1111/tra.12646. - DOI - PMC - PubMed
    1. Le L., Sirés-Campos J., Raposo G., Delevoye C. & Marks M. S. Melanosome biogenesis in the pigmentation of mammalian skin. Integrative and comparative biology (2021) doi:10.1093/icb/icab078. - DOI - PMC - PubMed
    1. Moreiras H., Seabra M. C. & Barral D. C. Melanin Transfer in the Epidermis: The Pursuit of Skin Pigmentation Control Mechanisms. International Journal of Molecular Sciences 22, 4466 (2021). - PMC - PubMed
    1. Benito-Martínez S. et al. Research Techniques Made Simple: Cell Biology Methods for the Analysis of Pigmentation. The Journal of investigative dermatology 140, 257–268.e8 (2020). - PMC - PubMed

Publication types