[Preprint]. 2025 Jan 18:2025.01.17.633452.
doi: 10.1101/2025.01.17.633452.

Rescue of hippocampal synaptic plasticity and memory performance by Fingolimod (FTY720) in APP/PS1 model of Alzheimer's disease is accompanied by correction in metabolism of sphingolipids, polyamines, and phospholipid saturation composition

Affiliations

Rescue of hippocampal synaptic plasticity and memory performance by Fingolimod (FTY720) in APP/PS1 model of Alzheimer's disease is accompanied by correction in metabolism of sphingolipids, polyamines, and phospholipid saturation composition

Karel Kalecký et al. bioRxiv. .

Abstract

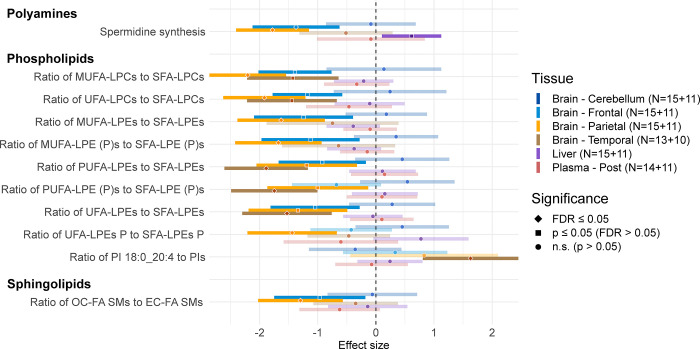
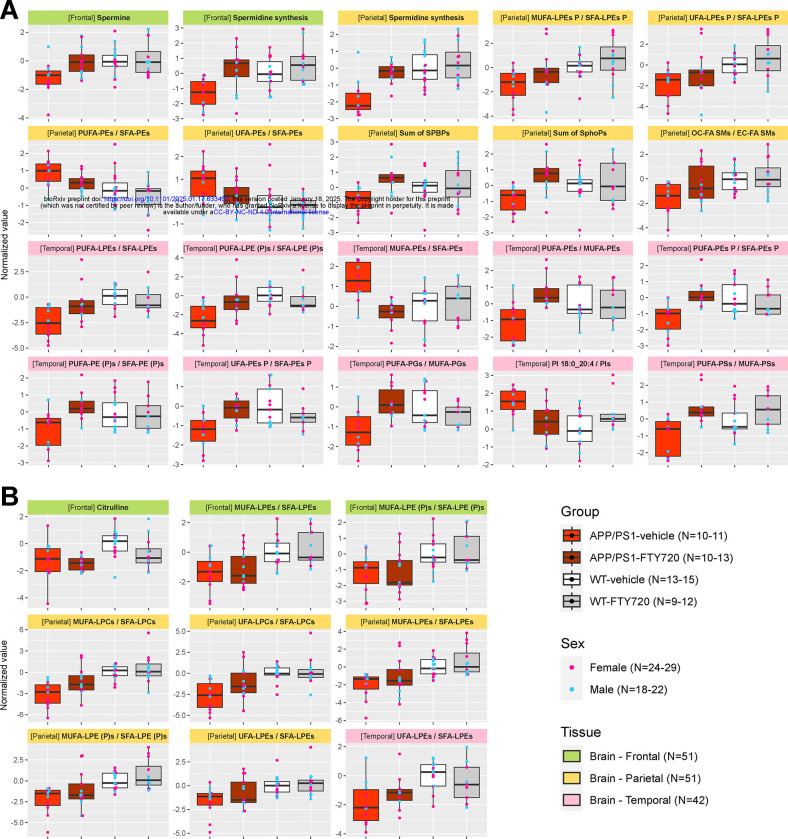
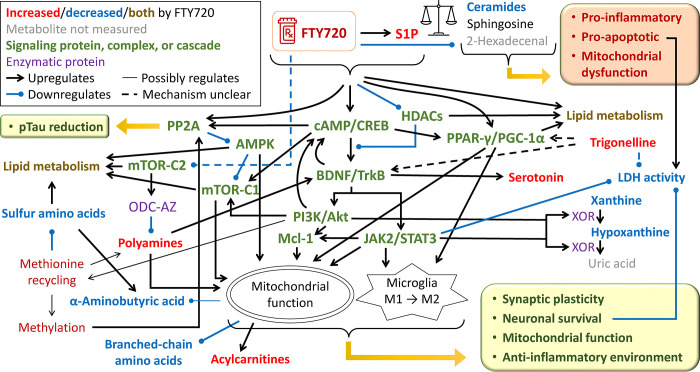
Previously, our metabolomic, transcriptomic, and genomic studies characterized the ceramide/sphingomyelin pathway as a therapeutic target in Alzheimer's disease, and we demonstrated that FTY720, a sphingosine-1-phospahate receptor modulator approved for treatment of multiple sclerosis, recovers synaptic plasticity and memory in APP/PS1 mice. To further investigate how FTY720 rescues the pathology, we performed metabolomic analysis in brain, plasma, and liver of trained APP/PS1 and wild-type mice. APP/PS1 mice showed area-specific brain disturbances in polyamines, phospholipids, and sphingolipids. Most changes were completely or partially normalized in FTY720-treated subjects, indicating rebalancing the "sphingolipid rheostat", reactivating phosphatidylethanolamine synthesis via mitochondrial phosphatidylserine decarboxylase pathway, and normalizing polyamine levels that support mitochondrial activity. Synaptic plasticity and memory were rescued, with spermidine synthesis in temporal cortex best corresponding to hippocampal CA3-CA1 plasticity normalization. FTY720 effects, also reflected in other pathways, are consistent with promotion of mitochondrial function, synaptic plasticity, and anti-inflammatory environment, while reducing pro-apoptotic and pro-inflammatory signals.


Conflict of interest statement

Disclosures and competing interests Karel Kalecký and Teodoro Bottiglieri are authors of the Integrator software, which was used for quantification of chromatographic signal, and which implements an approach described in a patent application (Application # PCT/US24/51426, filed on October 15, 2024) that is currently pending. Dr. Kaddurah-Daouk is an inventor on a series of patents on use of metabolomics for the diagnosis and treatment of CNS diseases and holds equity in Metabolon Inc., Chymia LLC and PsyProtix.

Figures

Fig. 1:
Fig. 1:. Metabolic alterations in APP/PS1 mice
Forest plot with metabolic differences in APP/PS1-vehicle mice that are statistically significant (FDR ≤ 0.05 for at least 1 tissue) compared to WT-vehicle in a linear regression model (see Methods for details). The normalized regression coefficients are shown on the x axis as points, with the shape denoting the statistical significance (diamond – FDR ≤ 0.05; square – FDR > 0.05 and p ≤ 0.05; circle – p > 0.05), located in the middle of a horizontal line depicting 95% confidence intervals, with lower opacity for insignificant results (p > 0.05). The vertical dashed line across 0 represents no group difference. Positive values mean an increase in APP/PS1-vehicle group. Individual types of tissue are color-coded (dark blue – cerebellum; light blue – frontal cortex; orange – parietal cortex; brown – temporal cortex; purple – liver; red – plasma). Sample counts for each tissue and group are included as “N” with WT group listed first.
Fig. 2:
Fig. 2:. Metabolic effects of FTY720 treatment in APP/PS1 mice
Forest plot with metabolic differences in APP/PS1-FTY720 mice that are statistically significant (FDR ≤ 0.05 for at least 1 tissue among APP/PS1 mice or APP/PS1 and WT combined) compared to APP/PS1-vehicle mice in a linear regression model (see Methods for details). The normalized regression coefficients are shown on the x axis as points, with the shape denoting the statistical significance (diamond – FDR ≤ 0.05; square – FDR > 0.05 and p ≤ 0.05; circle – p > 0.05), located in the middle of a horizontal line depicting 95% confidence intervals, with lower opacity for insignificant results (p > 0.05). The vertical dashed line across 0 represents no group difference. Positive values mean an increase in APP/PS1-FTY720 group. Individual types of tissue are color-coded (dark blue – cerebellum; light blue – frontal cortex; orange – parietal cortex; brown – temporal cortex; purple – liver; red – plasma). Sample counts for each tissue and group are included as “N” with APP/PS1-vehicle group listed first. Calculated metabolic indicators are displayed in italics for easier visual separation from measured metabolites. For complex lipids, only metabolic indicators are shown.
Fig. 3:
Fig. 3:. Effect of FTY720 treatment on metabolic alterations in APP/PS1 mice
Overview of analytes differentially present in APP/PS1 mice when considering all groups (see Methods for details) that showed A) strong improvement (≥ 50% of the genotype effect) by FTY720, and B) little to no improvement (< 50% of the genotype effect) by FTY720. The data show normalized values in individual box plots for each of the analytes and the respective tissue (headings color: green – frontal cortex; gold – parietal cortex; pink – temporal cortex). Each box (center line – median; box limits – upper and lower quartiles; whiskers – 1.5× interquartile range) represents one group (bright red – APP/PS1-vehicle; dark red – APP/PS1-FTY720; white – WT-vehicle; gray – WT-FTY720) and is overlayed with points corresponding to individual samples (blue – male; pink – female). Sample counts are included as “N” for each group and each sex with the minimum-maximum range across individual tissues, and for each tissue in total.
Fig. 4:
Fig. 4:. Effect of APP/PS1 genotype and FTY720 treatment on phenotype
Box plots for normalized values of individual behavioral (Target hole time – Barnes maze; Discrimination index and Distance – Novel object recognition test) and electrophysiological (LTP – long-term potentiation; PTP – post-tetanic potentiation; both in either CA3-CA1 hippocampal region or lateral entorhinal cortex (LEC)) measures. Each box (center line – median; box limits – upper and lower quartiles; whiskers – 1.5× interquartile range) represents one group (bright red – APP/PS1-vehicle; dark red – APP/PS1-FTY720; white – WT-vehicle; gray – WT-FTY720) and is overlayed with points corresponding to individual samples (blue – male; pink – female). Welch’s t-test p-values are provided for comparison between WT-vehicle and APP/PS1-vehicle groups, and between APP/PS1-vehicle and APP/PS1-FTY720 groups (p ≤ 0.05 are highlighted with blue font). Sample counts are included as “N” for each group and each sex with the minimum-maximum range across individual measurements.
Fig. 5:
Fig. 5:. Top metabolic analytes best corresponding to FTY720-related correction of abnormal phenotype in APP/PS1 mice
Scatter plots for top 10 analytes best corresponding (see Methods for details) to A) Target hole time (Barnes maze), and B) LTP in CA3-CA1 hippocampal region, among APP/PS1 mice across tissues. The values of these measurements (y-axis) and the respective top analytes (x-axis) are normalized. The type of tissue is specified and color-coded in the plot headings (green – fontal cortex; gold – parietal cortex; blue – liver; light green – plasma; pink – temporal cortex). Points represent individual samples and lines show the linear trend with 95% confidence intervals as shaded areas, with groups color-coded (red – APP/PS1-vehicle; blue – APP/PS1-FTY720). Sample counts are included as “N” for both groups with the minimum-maximum range across individual tissue types, and for each tissue with the number of samples in both groups where APP/PS1-vehicle is listed first.
Fig. 6:
Fig. 6:. Metabolic areas involved in FTY720-related rescue of APP/PS1 changes in metabolism and phenotype
Pathway map encompassing APP/PS1 metabolic alterations corrected by FTY720 and top 10 metabolic analytes best corresponding to FTY720-related correction of abnormal behavioral and electrophysiological tests in APP/PS1 mice. The known actions of FTY720 and relationships with mitochondrial function are included. The conversion between metabolites (black font) or upregulation are denoted by a regular black arrow, sometimes accompanied by the respective enzyme name (purple font; corresponds to metabolic indicators calculated as ratios from the main measured substrate and product metabolites), whereas downregulation is symbolized by a round-headed curve. For visual clarity, not all existing reactions and connections are shown. Ratios of lipid subgroups (green font in italics) are positioned adjacent to the respective lipid class. Mutually exclusive pathway split is marked with black “×”. Observed changes (red arrow up – increase; blue arrow down – decrease) are distinguished as related to APP/PS1 genotype (arrow before the label) and FTY720 action (arrow after the label), further highlighted where FTY720 correction occurred (yellow background). Top analytes best corresponding to phenotypic improvements are framed (red – positive correlation; blue – negative correlation; dark yellow – group contains metabolites correlated in both directions). The presence of the changes is also divided into central system (brain; light ochre background) and peripheral system (plasma and liver; light purple background), with possible overlap.
Fig. 7:
Fig. 7:. Assumed FTY720 mechanism of action and its effect on metabolism in APP/PS1 mice
Pathway map integrating current knowledge of FTY720 mechanism of action and how its downstream activation of several signaling pathways explains most of the observed metabolic changes related to FTY720 in APP/PS1 mice. The conversion between metabolites, signaling, or upregulation are denoted by a regular black arrow, sometimes accompanied by the respective enzyme name (purple font), whereas downregulation is symbolized by a round-headed blue curve. Relationships with mitochondrial function and switch in microglia polarization are included. The connections are dashed when the mechanism of action is unclear. Thin-line connections represent uncertainty in the strength and quantitative importance of the connection effect. For visual clarity, not all existing reactions and connections are shown. Connections with signaling proteins, protein complexes, and cascades (green font) are based on available literature. Metabolites and metabolic areas are color-coded with respect to the direction of observed change by FTY720 and significance (red – increased by FTY720; blue – decreased by FTY720; dark yellow – members of the class both increased and decreased by FTY720; black – no significant difference (FDR > 0.05); gray – metabolite not measured). For methionine recycling and methylation (dark red), indirect evidence suggests upregulation. The balance icon symbolizes rebalancing the “sphingolipid rheostat”.

Similar articles

References

    1. GBD 2016 Dementia Collaborators. Global, regional, and national burden of Alzheimer’s disease and other dementias, 1990–2016: a systematic analysis for the Global Burden of Disease Study 2016. Lancet Neurol. 18, 88–106 (2019). - PMC - PubMed
    1. Hutton M., Pérez-Tur J. & Hardy J. Genetics of Alzheimer’s disease. Essays Biochem. 33, 117–131 (1998). - PubMed
    1. Florence A. J. Local Love. (Igbo Studios, 2024).
    1. Sisodia S. S., Kim S. H. & Thinakaran G. Function and dysfunction of the presenilins. Am. J. Hum. Genet. 65, 7–12 (1999). - PMC - PubMed
    1. 2023 Alzheimer’s disease facts and figures. Alzheimers. Dement. 19, 1598–1695 (2023). - PubMed

Publication types

LinkOut - more resources