[Preprint]. 2025 Jan 15:2025.01.13.632801.
doi: 10.1101/2025.01.13.632801.

Molecular hallmarks of excitatory and inhibitory neuronal resilience and resistance to Alzheimer's disease

Affiliations

Molecular hallmarks of excitatory and inhibitory neuronal resilience and resistance to Alzheimer's disease

Isabel Castanho et al. bioRxiv. .

Update in

Abstract

Background: A significant proportion of individuals maintain healthy cognitive function despite having extensive Alzheimer's disease (AD) pathology, known as cognitive resilience. Understanding the molecular mechanisms that protect these individuals can identify therapeutic targets for AD dementia. This study aims to define molecular and cellular signatures of cognitive resilience, protection and resistance, by integrating genetics, bulk RNA, and single-nucleus RNA sequencing data across multiple brain regions from AD, resilient, and control individuals.

Methods: We analyzed data from the Religious Order Study and the Rush Memory and Aging Project (ROSMAP), including bulk (n=631) and multi-regional single nucleus (n=48) RNA sequencing. Subjects were categorized into AD, resilient, and control based on β-amyloid and tau pathology, and cognitive status. We identified and prioritized protected cell populations using whole genome sequencing-derived genetic variants, transcriptomic profiling, and cellular composition distribution.

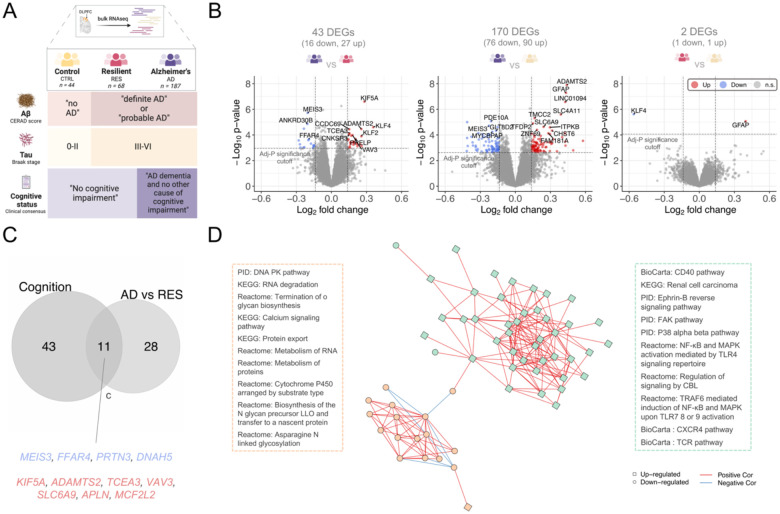
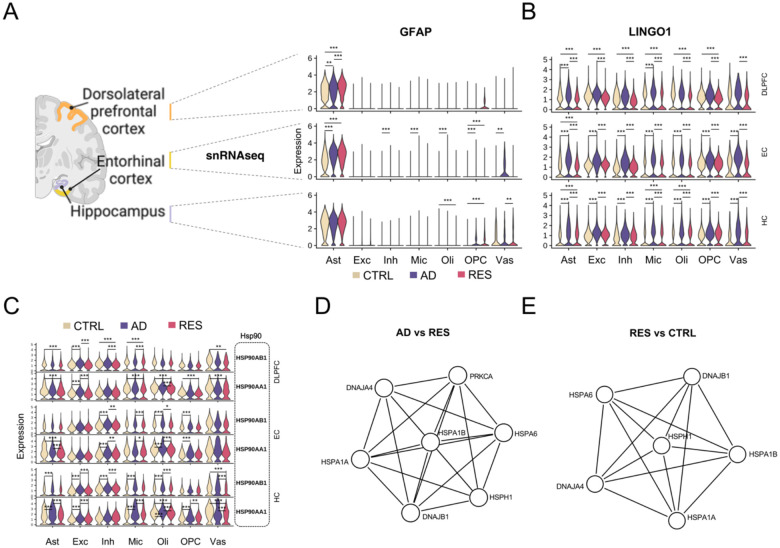
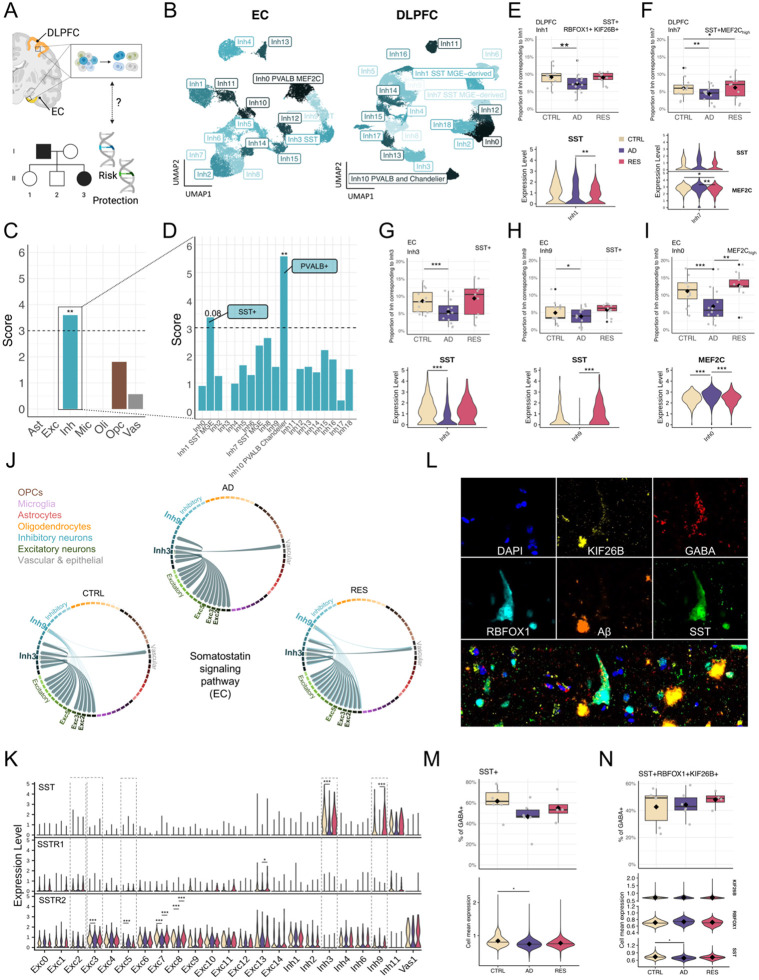
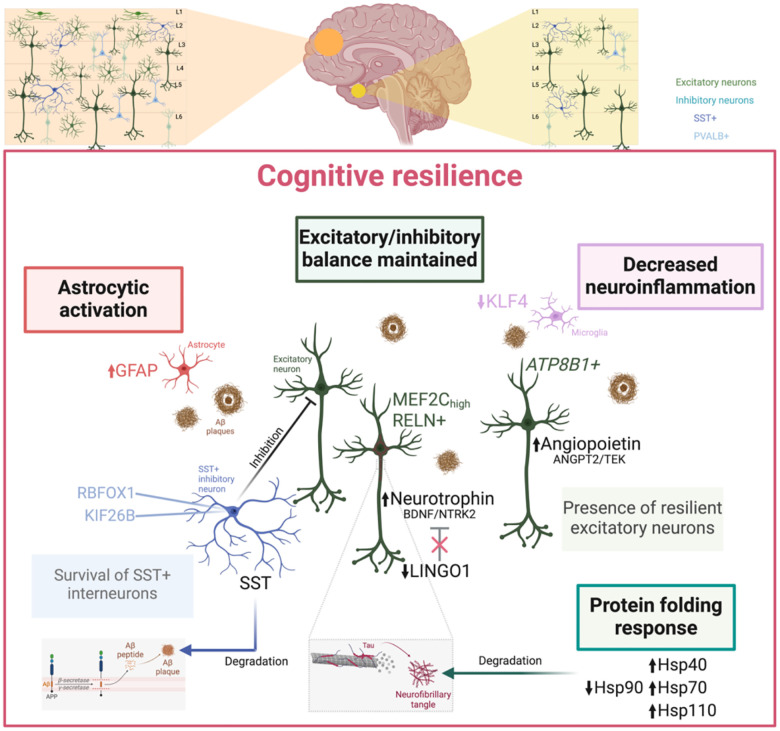
Results: Transcriptomic results, supported by GWAS-derived polygenic risk scores, place cognitive resilience as an intermediate state in the AD continuum. Tissue-level analysis revealed 43 genes enriched in nucleic acid metabolism and signaling that were differentially expressed between AD and resilience. Only GFAP (upregulated) and KLF4 (downregulated) showed differential expression in resilience compared to controls. Cellular resilience involved reorganization of protein folding and degradation pathways, with downregulation of Hsp90 and selective upregulation of Hsp40, Hsp70, and Hsp110 families in excitatory neurons. Excitatory neuronal subpopulations in the entorhinal cortex (ATP8B1+ and MEF2Chigh) exhibited unique resilience signaling through neurotrophin (modulated by LINGO1) and angiopoietin (ANGPT2/TEK) pathways. We identified MEF2C, ATP8B1, and RELN as key markers of resilient excitatory neuronal populations, characterized by selective vulnerability in AD. Protective rare variant enrichment highlighted vulnerable populations, including somatostatin (SST) inhibitory interneurons, validated through immunofluorescence showing co-expression of rare variant associated RBFOX1 and KIF26B in SST+ neurons in the dorsolateral prefrontal cortex. The maintenance of excitatory-inhibitory balance emerges as a key characteristic of resilience.

Conclusions: We identified molecular and cellular hallmarks of cognitive resilience, an intermediate state in the AD continuum. Resilience mechanisms include preservation of neuronal function, maintenance of excitatory/inhibitory balance, and activation of protective signaling pathways. Specific excitatory neuronal populations appear to play a central role in mediating cognitive resilience, while a subset of vulnerable SST interneurons likely provide compensation against AD-associated dysregulation. This study offers a framework to leverage natural protective mechanisms to mitigate neurodegeneration and preserve cognition in AD.

Keywords: Alzheimer’s disease; Cognitive resilience; gene expression; genetics; rare variants; transcriptomics; vulnerability.


Conflict of interest statement

Competing interests Authors declare that they have no competing interests.

Figures

Figure 1.
Figure 1.. Transcriptomic and pathway signatures of cognitive resilience against AD pathology.
(A) Overview of study design. Using levels of Aβ plaques and neurofibrillary tangles, and presence/absence of cognitive impairment, ROSMAP donors were classified into three major categories: Control (CTRL, CERAD “no AD”, Braak 0-II, and consensus cognitive diagnosis “no cognitive impairment”), Resilient (RES, CERAD “definite AD” or “probable AD”, Braak III-VI, and consensus cognitive diagnosis “no cognitive impairment”), and AD (CERAD “definite AD” or “probable AD”, Braak III-VI, and consensus cognitive diagnosis “Alzheimer’s dementia and no other cause of cognitive impairment”). (B) Volcano plots showing significantly (adj-P < 0.1) differentially expressed genes (DEGs) in AD compared to resilient individuals (ADvsRES), AD compared to controls (ADvsCTRL), and resilient compared to controls (RESvsCTRL). DEGs with log2FC < −log2(1.1) are highlighted in blue, and DEGs with log2FC > log2(1.1) are highlighted in red. The horizontal lines represent FDR-adjusted P-value = 0.1. (C) Venn diagram showing common genes identified as DEGs in ADvsRES and identified as associated with cognitive decline. Down-regulated genes are shown in blue, and up-regulated genes in red. (D) Two major classes of dysregulated functions in ADvsRES identified by pathway activity analysis. Nodes represent pathways with significant dysregulation of activity (q-value < 0.1) in ADvsRES. Out of a total of 99 dysregulated pathways between ADvsRES, 62 organized in two unsupervised clusters of expression. Node shapes denote up-regulation and down-regulation in AD. Edges represent co-expression of pathways based on the Pathway Co-expression Network background. Pathway activity profiles were determined using the PanomiR software package. Pathway dysregulation p-values were determined using the Limma package’s linear regression models contrasting between ADvsRES and accounting for confounding covariates such as age, batch, and RNA integrity number. Figure created in part with BioRender.com.
Figure 2.
Figure 2.. Cell-specific transcriptomic signatures of cognitive resilience against AD pathology.
(A-C) Violin plots showing gene expression for selected DEGs across different major cell types from each brain region. Log2FC, adjusted P-values (adj-P), and direction of change (first diagnostic group compared to the second group) are shown in Table S14. * Adj-P < 0.05, ** Adj-P < 0.01, *** Adj-P < 0.001. (A) Changes in the expression of GFAP. (B) Down-regulation of LINGO1 in cognitive resilience. (C) Down-regulation of Hsp90 (heat shock protein 90) family members in cognitive resilience. (D-E) Protein-protein interaction (PPI) networks in excitatory neurons generated using Metascape. Molecular Complex Detection (MCODE) algorithm network clusters (modules) showing the subset of proteins that form physical interactions with at least one other member in the list. The protein networks were constructed based on physical interactions among all input gene lists. (D) PPI network clusters detected from genes up-regulated in excitatory neurons (DLPFC) in resilience from ADvsRES. The three best-scoring terms by p-value from pathway and process enrichment analysis for this module were “chaperone cofactor-dependent protein refolding” (GO:0051085, Log10(P) = −12.6), “‘de novo’ post-translational protein folding” (GO:0051084, Log10(P) = −12.3), and “‘de novo’ protein folding” (GO:0006458, Log10(P) = −12.1). (E) PPI network cluster detected from genes up-regulated in excitatory neurons (DLPFC) in resilience from RESvsCTRL. The three best-scoring terms by p-value from pathway and process enrichment analysis for this module were “chaperone cofactor-dependent protein refolding” (GO:0051085, Log10(P) = −13.2), “‘de novo’ post-translational protein folding” (GO:0051084, Log10(P) = −12.9), and “‘de novo’ protein folding” (GO:0006458, Log10(P) = −12.6).
Figure 3.
Figure 3.. Inhibitory neurons as key players in protection against AD.
(A) Brain regions analyzed; created with BioRender.com. (B) UMAP embedding of inhibitory neurons from the EC (left) and DLPFC (left). (C-D) Cellular enrichment results of genes annotated with protective rare variants in (C) major cell types and (D) subtypes of inhibitory neurons from the DLPFC. Y-axis shows standard deviation from the bootstrapped mean. Stars denote Bonferroni-adjusted P-values. (E-I) Distributions of cell proportion (top) and gene expression levels of marker genes (bottom) for the DLPFC (E) Inh1, (F) Inh7, and the EC (G) Inh3, (I) Inh9, and (J) Inh0 subpopulations. Stars show FDR-adjusted P-values from a Dirichlet multinomial regression model (Table S18). (J) Chord diagrams displaying the SST signaling pathway in cell subpopulations from the EC with significant changes per diagnostic group (Figure S12 and Table S17). (K) Expression levels of the ligand and receptors involved in the SST signaling pathway shown in (J). (L) Representative image from IF staining of markers in a resilient DLPFC brain section. (M) Proportions of all SST+ (GABA+) cells in each subject across diagnostic groups (top). Distribution of mean SST normalized intensities in SST+ cells (bottom). Nsubjects = 16 (6 CTRL, 6 AD, 4 RES), Ncells = 1,279,938 (CTRL = 434,270, AD = 559,681, RES = 285,987). (N) Distribution of proportions of all SST+ RBFOX1+ KIF26B+ (GABA+) cells (top). Distribution of mean intensities of each marker in SST+ RBFOX1+ KIF26B+ cells (bottom). Nsubjects = 16 (6 CTRL, 6 AD, 4 RES), Ncells = 721,126 (CTRL = 261,938, AD = 315,542, RES = 143,646). Stars in top (M) and (N) indicate FDR-adjusted P-values from a Dirichlet multinomial regression. Stars in bottom (M) and (N) indicate nominal P values of a Wilcoxon test on the subject-level means; diamonds show the grand mean. *Adj.P < 0.05, ** Adj.P < 0.01, *** Adj.P < 0.001
Figure 4.
Figure 4.. Excitatory neuronal subpopulations expressing MEF2C and ATP8B1 exhibiting resilient behavior.
(A) Brain region for which results are shown in the figure. Figure created in part with BioRender.com. (B) UMAP plot showing the subclusters (‘subpopulations’) investigated in excitatory neurons from the EC, identified using the Harmony algorithm, in the ROSMAP cohort. See Table S14 for detailed annotations. (C-E) Cell proportion distributions for the MEF2Chigh ATP8B1+ RELN+ EC:Exc2 subpopulation (C), ATP8B1+ EC:Exc3 subpopulation (D), and MEF2C RELN+ EC:Exc5 subpopulation (E). A Dirichlet multinomial regression model was used to identify differences in cell proportions among the three diagnostic groups. P-values were adjusted using FDR correction. (F) Immunofluorescence representative pictures showing NeuN, RELN, MEF2C, ATP8B1, and Aβ in EC brain sections from an independent cohort. (G) Box plots showing cell proportion distributions for MEF2ChighATP8B1+ RELN+ (top; top left: positivity in the cytoplasm and cell membrane; top right: positivity in the nucleus), ATP8B1+ (bottom left), and MEF2Chigh RELN+ (bottom right) neurons (NeuN+), identified by immunostaining. Stars indicate significance level based on FDR-adjusted P-values from a Dirichlet multinomial regression model. Nsubjects = 17 (6 CTRL, 6 AD, 5 RES), Ncells = 81549 (CTRL = 19596, AD = 28107, RES = 33846) cells. (H-I) Chord diagrams displaying the neurotrophin (NT) signaling pathway (H) and angiopoietin (ANGPT) signaling pathway in cell subpopulations in the EC, predicted as significantly changing (Figure S12 and Table S17) from a cell-cell communication analysis based on ligand-receptor interactions. * Adj-P < 0.05, ** Adj-P < 0.01, *** Adj-P < 0.001.
Figure 5.
Figure 5.. A functional model of resilience.
Our model proposes that cognitive resilience is driven by the maintenance of the excitatory/inhibitory neuronal balance (dark green), sustained by resilient excitatory neurons expressing MEF2C and ATP8B1. These neurons engage in resilience-relevant signaling pathways, including neurotrophin (BDNF/NTRK2), modulated by the down-regulation of LINGO1, and angiopoietin (ANGPT2/TEK). Protein folding and degradation processes are reorganized in resilience, with increased expression of Hsp40, Hsp70, and Hsp110 in excitatory neurons and down-regulation of Hsp90, enhancing the degradation of pathological tau (mint green). SST+ inhibitory neurons, typically vulnerable in AD, are preserved in resilience, including subpopulations expressing RBFOX1 and KIF26B (blue), contributing to the balance of neuronal excitation. Additionally, SST release from these neurons promotes the degradation and clearance of pathological Aβ. In terms of glial response, resilience shows astrogliosis marked by increased GFAP in astrocytes (red), a feature shared with AD. However, it contrasts with AD by exhibiting a reduction or absence of microglial activation, characterized by decreased KLF4 expression, leading to reduced neuroinflammation (pink). Figure created with BioRender.com.

References

    1. Arenaza-Urquijo EM, Vemuri P. Resistance vs resilience to Alzheimer disease: Clarifying terminology for preclinical studies. Neurology. 2018;90:695–703. - PMC - PubMed
    1. Aiello Bowles EJ, Crane PK, Walker RL, Chubak J, LaCroix AZ, Anderson ML, et al. Cognitive resilience to Alzheimer’s disease pathology in the human brain. J Alzheimers Dis. 2019;68:1071–83. - PMC - PubMed
    1. Arboleda-Velasquez JF, Lopera F, O’Hare M, Delgado-Tirado S, Marino C, Chmielewska N, et al. Resistance to autosomal dominant Alzheimer’s disease in an APOE3 Christchurch homozygote: a case report. Nat Med. 2019;25:1680–3. - PMC - PubMed
    1. Dumitrescu L, Mahoney ER, Mukherjee S, Lee ML, Bush WS, Engelman CD, et al. Genetic variants and functional pathways associated with resilience to Alzheimer’s disease. Brain. 2020;143:2561–75. - PMC - PubMed
    1. Eissman JM, Dumitrescu L, Mahoney ER, Smith AN, Mukherjee S, Lee ML, et al. Sex differences in the genetic architecture of cognitive resilience to Alzheimer’s disease. Brain. 2022;145:2541–54. - PMC - PubMed

Publication types

LinkOut - more resources