[Preprint]. 2025 Jul 1:2025.01.16.633409.
doi: 10.1101/2025.01.16.633409.

Genetically encoded mechano-sensors with versatile readouts and compact size

Affiliations

Genetically encoded mechano-sensors with versatile readouts and compact size

Yuan Ren et al. bioRxiv. .

Abstract

Mechanical forces are critical for virtually all fundamental biological processes, yet quantification of mechanical forces at the molecular scale in vivo remains challenging. Here, we present a new strategy using calibrated coiled coils as genetically encoded, compact, tunable, and modular mechano-sensors to substantially simplify force measurement in vivo, via diverse readouts (luminescence, fluorescence and analytical biochemistry) and instrumentation readily available in biology labs. We demonstrate the broad applicability and ease-of-use of these coiled coil mechano-sensors by measuring forces during cytokinesis (formin Cdc12) and endocytosis (epsin Ent1) in yeast, force distributions in nematode axons (β-spectrin UNC-70), and forces transmitted to the nucleus (mini-nesprin-2G) and within focal adhesions (vinculin) in mammalian cells. We report discoveries in intracellular force transmission that have been elusive to existing tools.


Conflict of interest statement

Declaration of interests Julien Berro, Yuan Ren and Yongli Zhang have a pending patent application PCT/US2023/069505.

Figures

Figure 1.
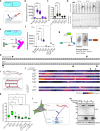
Figure 1.. Rational design and calibration of coiled coils as force-sensing modules.
a, A DNA hairpin (TP9) with defined nucleotide composition unfolds at a characteristic force threshold. Fluorescence readouts (such as a fluorophore-quencher pair) can be added to nucleotides by chemical modifications on the DNA hairpin so that change in fluorescence reports the digital opening of the DNA under force. b, An elastic peptide (HP35) sandwiched by two fluorescent proteins (mTurquoise2 and mNeonGreen) form a genetically encoded force sensor,. The FRET efficiency between the two fluorescent proteins depends on the peptide length, which scales linearly with force magnitude within a small range (e.g. 3–6 pN). c, Calibrated coiled coils can be used as force-sensing modules to correlate mechanical force to their conformational change. Readouts are protein constructs that can only bind to the linkers connecting the two α-helices of the coiled-coil when the coiled-coil is unfolded under force. a-c, Molecules are shown at the same scale, and the structures are predicted by AlphaFold3 and colored according to the residues’ b-factors. Arrows indicate the directions of force pulling. d, Cumulative unfolding probability of the coiled coil force sensor 7pN as a function of force. The jump of the unfolding probability from below 0.1 to above 0.9 within 1 pN indicates a near-digital response to mechanical forces. e-i, Predicted structures of 5pN,7pN,10pN,11pN and 13pN with their GS linkers (GGSSGG) highlighted in cyan are shown at the same scale as a-c. Mechanical stabilities are tuned by mutating the hydrophobic core (amino acids in positions a and d) and by changing the total number of heptads. See also Fig. S1 for helical wheel depictions. j, Representative force-extension curves (FECs) obtained by pulling (grey) or relaxing (black) coiled coil sensors using optical tweezers. The conformations of the coiled coils are labeled as follows: 1, folded state; 2, unfolded state; and 2*, partially unfolded state. k, Unfolding force thresholds of coiled coils are calibrated by optical traps. Each dot represents a pulling event. l, The selection of functional linkers and their binding partners offers modularity in force sensor readouts. Readouts with slow unbinding kinetics are force recorders (HiBiT and LgBiT; GFP11 and GFP1–10; TEV cleaving site (TEVcs) and TEVp), while readouts with fast unbinding kinetics are force live reporters (IAAL-K3 and IAAL-E3; SsrA and SspB).
Figure 2.
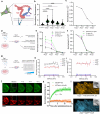
Figure 2.. Modular assembly of mechano-sensors with versatile readouts in multiple biological systems.
a, Schematic of the role of Cdc12 during cytokinesis in the fission yeast S. pombe. Cdc12 nucleates and polymerizes actin filaments, and bridges F-actin to the cytokinetic nodes on the plasma membrane. Force sensors are inserted after A216 of cdc12 genomic location. b, Force measurement on Cdc12 using the split-NanoLuc readout. Ordinary one-way ANOVA was performed with Tukey’s multiple comparison tests with “No-HiBiT” as the control and only displayed for pairs where p values is less than 0.05. ****, p<0.0001. Each dot represents one measurement with >1000 cells. Data are pooled from three independent repeats. c, Force measurement on Cdc12 using the split-GFP readout. Ordinary one-way ANOVA was performed with Tukey’s multiple comparison tests with “No-GFP11” as the control and only displayed for pairs where p values is smaller than 0.05. ****, p<0.0001. Each dot represents measurement from a single cell. Data are pooled from more than three independent experiments. d, Timelapse of force on Cdc12 (3pNIAALK3 and mEGFP-IAAL-E3 binder) and the cytokinetic ring (Rlc1-sfCherry) during fission yeast cytokinesis. Sad1-mCherry is used to locate the dividing spindle pole body and to time cytokinesis. Force on Cdc12 starts to build up above 3 pN at the beginning of ring maturation and drops below 3 pN before the ring fully disassembles. Arrowheads indicate the recruitment of mEGFP to Cdc12 when 3pNIAALK3 is unfolded by force. Scale bar, 5 μm. e, Schematic of Ent1 and its interacting partners during clathrin-mediated endocytosis (CME) in the fission yeast. Force sensors are inserted after P571 at ent1 genomic location. ENTH, N-terminal lipid-binding domain. ACB, actin cytoskeleton-binding domain. CBM, clathrin-binding motif. f, Force measurement on Ent1 using the split-NanoLuc readout. ~6 pN force is detected on Ent1 and the deletion of CMB decreased the luminescence signal detected, indicating a smaller fraction of Ent1 molecules under force. Ordinary one-way ANOVA was performed with “No-HiBiT” as the control and only displayed for pairs where p values is smaller than 0.05. *, p<0.05; **, p<0.01; ***, p<0.001; ****, p<0.0001. Each dot represents one independent experiment with >1000 cells. See also Fig. S5 for controls and force measurement on different sites of Ent1. g, Dual-color TIRF is used to simultaneously track the force on Ent1 (3pNIAALK3 and mEGFP-IAAL-E3 binder) and actin dynamics (Fim1-mScarlet-I) in fission yeast cells. Scale bar, 5 μm. h, Montage of a representative CME event. Note that force on Ent1 increases to above 3 pN ~30 s before actin assembly begins. Arrowheads denote the first and last frames where force on Ent1 is above 3 pN. i, Position of the sensory PLM neuron in the nematode C. elegans. Spectrins (UNC-70 and SPC-1), shown as spirals in the zoomed region, form the central building block of the membrane associated periodic skeleton (MPS), which consists of actin rings that are interspaced by spectrin tetramers below the plasma membrane throughout the entire length of the axon. Force sensors were inserted into the genomic unc-70 locus between spectrin repeats 8 and 9 (after R1167). Only one coiled coil is shown for clarity. See Fig. S6 for details of force sensor insertion. j, Representative maximum projections of C. elegans strains expressing UNC-70 with force sensors together with GFP1–10 under a PLM specific promoter (mec-17p) in wildtype or in a loss of function mutant of unc-115(ky275). Signal intensity is color coded according to the displayed color bar. Scale bar, 50 μm. The position of the cell body (*) and the rectum (#) are indicated. Background fluorescence outside of the axon region was not included in quantification. Example images are rescaled in X and Y dimension (1:2) to enlarge the neurite diameter for better visualization. k, Quantification of fluorescence in j. Multiple comparisons with the Kruskal-Wallis test. *, p<0.05. ****, p<0.0001. Each dot represents measurement from a single axon. l, Mini-Nesprin-2G transmits forces from cytoplasmic actin filaments to SUN in the nucleus. 5pNTEVcs and 10pNTEVcs were inserted between the N-terminal filamentous actin-binding CH domain (1–485) and the C-terminal KASH SUN-binding domain (6525–6874). m, Immunoblot of cell lysates from U2OS cells transfected with 5pNTEVcs or 10pNTEVcs in mini-Nesprin-2G. Note that cleavage of 5pNTEVcs is observed upon co-transfection with TEVp, whereas 10pNTEVcs is resistant to TEVp activity (TEVp-HA +). Representative Western blot of two independent repeats. All schematics in this figure are for illustrative purpose only and not drawn to scale. Some schematics were created with BioRender.com.
Figure 3.
Figure 3.. Comprehensive force measurements on vinculin.
a, Vinculin binds to talin and F-actin in focal adhesions and contributes to force transmission between the extracellular matrix and the cytoskeleton. b, Quantification of force on vinculin with the Split-GFP readout. U2OS cells were plated on glass and transfected with plasmids encoding mCherry-vinculin with different force sensors inserted after E883 using the split-GFP readout. GFP fluorescence is normalized to mCherry-vinculin signals. Each dot represents measurement from a segmented focal adhesion. Data are pooled from two independent experiments. Ordinary one-way ANOVA was performed with Tukey’s multiple comparison tests with “No-GFP11” as the control. ****, p<0.0001. c, Force distribution of vinculin, calculated by normalizing the fluorescence signals from 5pNGFP11,7pNGFP11, and 10pNGFP11 to that from 3pNGFP11. Mean ± SEM. d, Schematic for comparing the forces on vinculin from cells plated on glass or Matrigel for 6 hours. e, Quantification of force on vinculin with the Split-Nanoluc readout. Luminescence is normalized to mCherry-vinculin signals to compare the number of mechanically active vinculin molecules. Multiple comparisons with Kruskal-Wallis test. *, p<0.05. f, Force distribution on vinculin, calculated by normalizing the luminescence signals from different sensors to that from 3pNGFP11. Multiple comparisons with Kruskal-Wallis test. *, p<0.05. g, U2OS cells were transfected with force sensors, collected, and plated onto substrates with different stiffnesses. Luminescence was measured to detect the forces on vinculin after overnight culture. h, Quantification of force on vinculin across substrate stiffness. Data are shown as mean ± SEM with fitted lines of linear regression. The slopes of the fitted lines are not significantly different from zero (F-test). i, Force distribution on vinculin calculated by normalization to 3pNGFP11. Data are shown as mean ± SEM with fitted lines of linear regression. The fraction of forces on vinculin was not changed by the substrate stiffness according to the F-test on the slopes of the fitted lines. j, U2OS cells were transfected by plasmids encoding mCherry-vinculin-E883-3pNIAALK3 and mEGFP-IAAL-E3. FRAP was performed to compare the recovery of mEGFP and mCherry signals in focal adhesions. Scale bar: 5 μm. k, Quantification of fluorescence intensities after photobleaching. mEGFP signals recover with t1/2=1.6s, indicating fast binding and unbinding kinetics for the live force reporter. l, U2OS cells were transfected with vinculin-E883-3pNIAALK3 with mScarlet-3-IAAL-E3 binder, and vinculin-E883-5pNSsrA with TagBFP-SspB binder. Signals corresponding to 3pNIAALK3 are closer to the cell edge and stronger in focal adhesions than 5pNSsrA. Scale bar, 10 μm. All schematics in this figure are for illustrative purpose only and not drawn to scale. Some schematics were created with BioRender.com.

Similar articles

References

    1. Wang X. & Ha T. Defining single molecular forces required to activate integrin and notch signaling. Science 340, 991–994 (2013). - PMC - PubMed
    1. Blakely B. L. et al. A DNA-based molecular probe for optically reporting cellular traction forces. Nat Methods 11, 1229–1232 (2014). - PMC - PubMed
    1. Zhang Y., Ge C., Zhu C. & Salaita K. DNA-based digital tension probes reveal integrin forces during early cell adhesion. Nat Commun 5, 5167 (2014). - PMC - PubMed
    1. Grashoff C. et al. Measuring mechanical tension across vinculin reveals regulation of focal adhesion dynamics. Nature 466, 263 (2010). - PMC - PubMed
    1. Suzuki A. et al. How the kinetochore couples microtubule force and centromere stretch to move chromosomes. Nat Cell Biol 18, 382–392 (2016). - PMC - PubMed

Publication types

LinkOut - more resources