[Preprint]. 2025 Apr 16:2025.01.14.633019.
doi: 10.1101/2025.01.14.633019.

Dissociation of SYNGAP1 Enzymatic and Structural Roles: Intrinsic Excitability and Seizure Susceptibility

Affiliations

Dissociation of SYNGAP1 Enzymatic and Structural Roles: Intrinsic Excitability and Seizure Susceptibility

Julia Brill et al. bioRxiv. .

Update in

Abstract

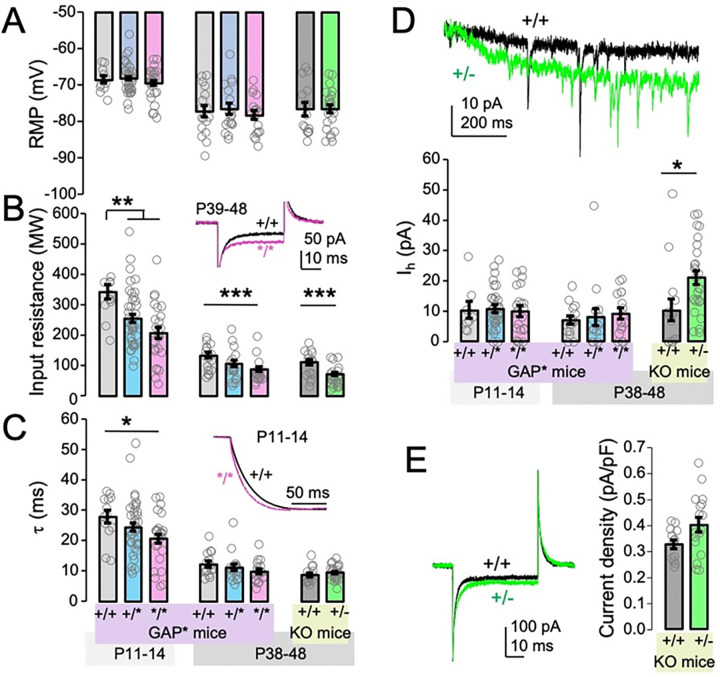
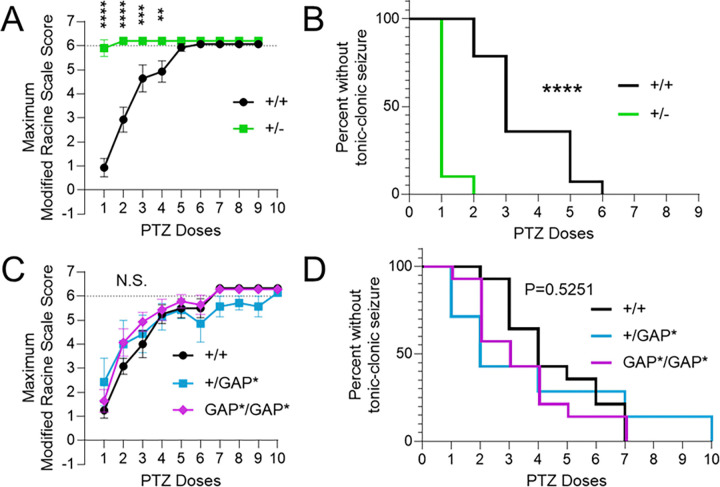
SYNGAP1 is a key Ras-GAP protein enriched at excitatory synapses, with mutations causing intellectual disability and epilepsy in humans. Recent studies have revealed that in addition to its role as a negative regulator of G-protein signaling through its GAP enzymatic activity, SYNGAP1 plays an important structural role through its interaction with post-synaptic density proteins. Here, we reveal that intrinsic excitability deficits and seizure phenotypes in heterozygous Syngap1 knockout (KO) mice are differentially dependent on Syngap1 GAP activity. Cortical excitatory neurons in heterozygous KO mice displayed reduced intrinsic excitability, including lower input resistance, and increased rheobase, a phenotype recapitulated in GAP-deficient Syngap1 mutants. However, seizure severity and susceptibility to pentylenetetrazol (PTZ)-induced seizures were significantly elevated in heterozygous KO mice but unaffected in GAP-deficient mutants, implicating the structural rather than enzymatic role of Syngap1 in seizure regulation. These findings highlight the complex interplay between SYNGAP1 structural and catalytic functions in neuronal physiology and disease.

Keywords: GTPase-activating protein; epilepsy; intrinsic excitability; liquid-liquid phase separation; neurodevelopmental disorders.


Conflict of interest statement

Competing interest statement R.L.H. is scientific co-founder and SAB member of Neumora Therapeutics.

Figures

Figure 1.
Figure 1.. Layer 2/3 pyramidal cells in Syngap1 +/GAP* and GAP*/GAP* mice have reduced intrinsic excitability, similar to heterozygous KO mice.
(A-D) Data from P38–48 GAP* and KO mice. (A) Example current clamp traces in from 500 ms current injections in +/+ (WT), */GAP* (+/*) and GAP*/GAP* (*/*) cells, showing reduced spiking and increased rheobase in +/* and */* cells. Current injections of +150, +225, +300 and +375 pA (bottom to top). (B) Summary graphs showing spike threshold in pyramidal cells from +/+, +/* and */* mice, as well as +/+ and +/− mice. (C) Input/output curves showing spike frequency in response to hyperpolarizing and depolarizing current injections for GAP* mice. Inset: Rheobase in +/+,+/* and */* cells. (D) Input/output curves showing spike frequency in response to hyperpolarizing and depolarizing current injections for KO mice. Inset: Rheobase in +/+ and +/−cells. (E-H) Data from P11–14 GAP* mice. (E) Example current clamp traces in from 500 ms current injections in +/+ (WT), */GAP* (+/*) and GAP*/GAP* (*/*) cells, showing reduced spiking and increased rheobase in +/* and */* cells. Current injections of +50, +125, +200 and +275 pA (bottom to top). (F) Top: Representative action potentials from WT (black) and */* (magenta) mice, scaled to peak and aligned to threshold. Bottom: Phase plot (V vs ΔV) from the action potentials shown in the left. The action potential from the */* cell has a shorter halfwidth and both faster rise and decay phases. (G) Input/output curves showing spike frequency in response to hyperpolarizing and depolarizing current injections for GAP* mice. Inset: Rheobase in +/+,+/* and */* cells. (H) Summary graphs showing spike halfwidth in pyramidal cells from +/+, +/* and */* mice. *, **, *** indicate p<0.05, p<0.01, p<0.005, respectively. Unpaired t-test for comparing +/+ vs. +/−; ANOVA for comparing +/+ vs +/* vs */*.
Figure 2.
Figure 2.. Decreased input resistance is the likely cause of reduced excitability.
(A-C) Passive membrane properties. Summary graphs showing RMP (A), input resistance (B) and membrane time constant (C) in pyramidal cells from younger and older wt, +/* and */* mice, as well as wt and +/− mice. Insets in B and C show representative traces from wt and */* mice highlighting decreased input resistance in */* (B) and shorter membrane time constant in */* cells the younger age group (C). (D) Ih. Top: Exemplar traces from P38–48 WT (black) and +/− (green) mice showing currents in response to a hyperpolarizing voltage step (−60 to −85 mV) to measure Ih. A larger current is observed in the +/− cell. Bottom: Summary graphs showing Ih in pyramidal cells from younger and older wt, +/* and */* mice, as well as wt and +/− mice. The only significant difference is observed in cells from +/− mice. (E) Leak potassium currents. Left: Example response to −60 to −65 mV voltage step in the presence of TTX and CdCl2 in cells from wt (black) and +/− (green) animals, aged P30–35. Larger current is evoked in the +/− cell, indicating higher leak currents. Cell capacitance was measured as the area under the curve of the second capacitive current transient (which is similar in both cells). Right: Summary graphs showing leak current density (current/capacitance) in wt and +/− cells. Current density is increased in +/− cells, consistent with larger leak potassium currents. *, **, *** indicate p<0.05, p<0.01, p<0.005, respectively. Unpaired t-test for comparing +/+ vs. +/−; ANOVA for comparing +/+ vs +/* vs */*.
Figure 3.
Figure 3.. PTZ-induced seizure severity and susceptibility are heightened in Syngap1 heterozygous knockout but not +/GAP* and GAP*/GAP* mice.
(A,C) Modified Racine scale scores were used to evaluate PTZ-induced seizures. Maximum scores following sequential PTZ administration (40 mg/kg initial dose, 10 mg/kg every 5 minutes, until a score of 6 or higher was observed) in Syngap1 KO (A) and GAP* (C) mutants were plotted. Dotted line indicates tonic-clonic seizure threshold. Data points show mean ± SEM. *, **, ***, **** indicate p<0.05, p<0.01, p<0.001, p<0.0001, respectively. Two-way ANOVA (genotype × dose) with Šídák’s multiple comparisons test was used to compare seizure severity for each PTZ dose. (B,D) Survival plots showing percentage of mice without tonic-clonic seizures for Syngap1 KO (B) and GAP* (D) mutants after each administration. The Log-rank (Mantel-Cox) test was used to compare survival curves.

References

    1. Gamache T. R., Araki Y., Huganir R. L., Twenty years of SynGAP Research: From Synapses to Cognition. Journal of Neuroscience 40, 1596–1605 (2020). - PMC - PubMed
    1. Jeyabalan N., Clement J. P., SYNGAP1: Mind the Gap. Frontiers in Cellular Neuroscience (2016). - PMC - PubMed
    1. Chen H.-J., Rojas-Soto M., Oguni A., Kennedy M. B., A Synaptic Ras-GTPase Activating Protein (p135 SynGAP) Inhibited by CaM Kinase II. Neuron 20, 895–904 (1998). - PubMed
    1. Kim J. H., Liao D., Lau L.-F., Huganir R. L., SynGAP: a Synaptic RasGAP that Associates with the PSD-95/SAP90 Protein Family. Neuron 20, 683–691 (1998). - PubMed
    1. Nonaka M., Doi T., Fujiyoshi Y., Takemoto-Kimura S., Bito H., Essential contribution of the Ligand-Binding ΒB/ΒC Loop of PDZ1 and PDZ2 in the regulation of postsynaptic clustering, scaffolding, and localization of postsynaptic density-95. Journal of Neuroscience 26, 763–774 (2006). - PMC - PubMed

Publication types