[Preprint]. 2025 Jul 12:2025.01.09.632263.
doi: 10.1101/2025.01.09.632263.

Dimerization and dynamics of angiotensin-I converting enzyme revealed by cryo-EM and MD simulations

Affiliations

Dimerization and dynamics of angiotensin-I converting enzyme revealed by cryo-EM and MD simulations

Jordan M Mancl et al. bioRxiv. .

Abstract

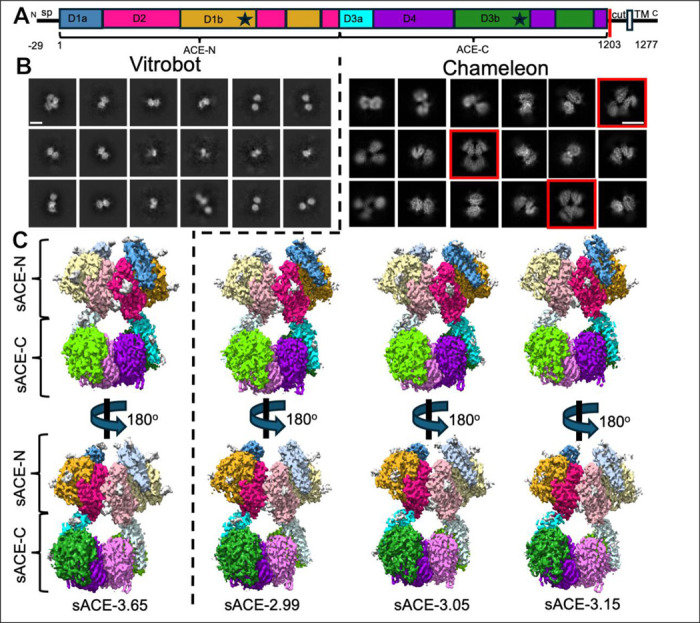
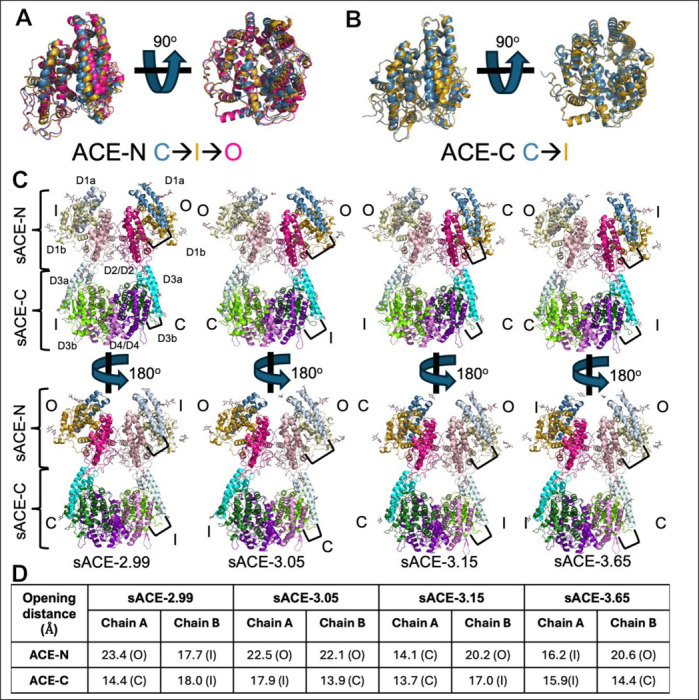
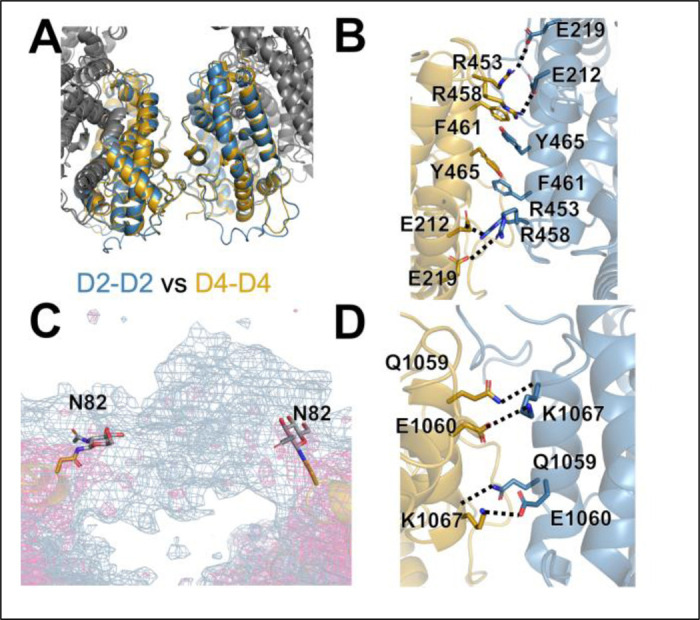
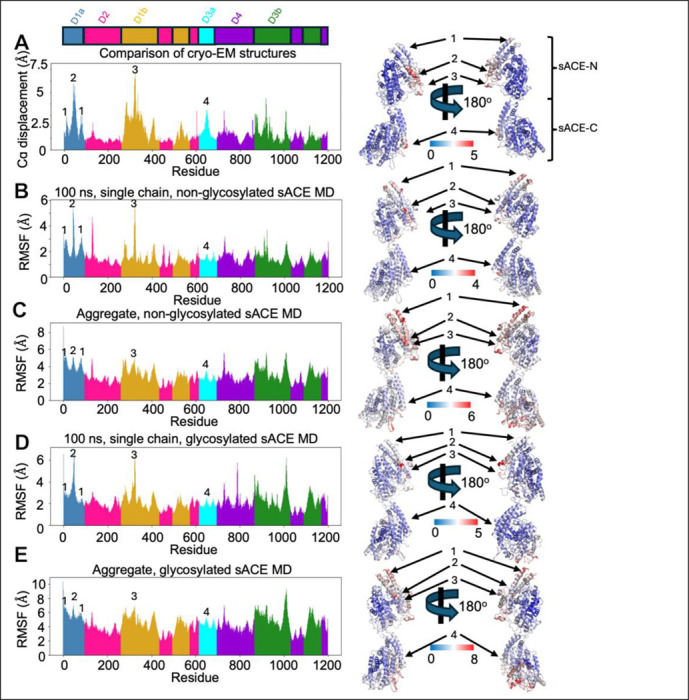
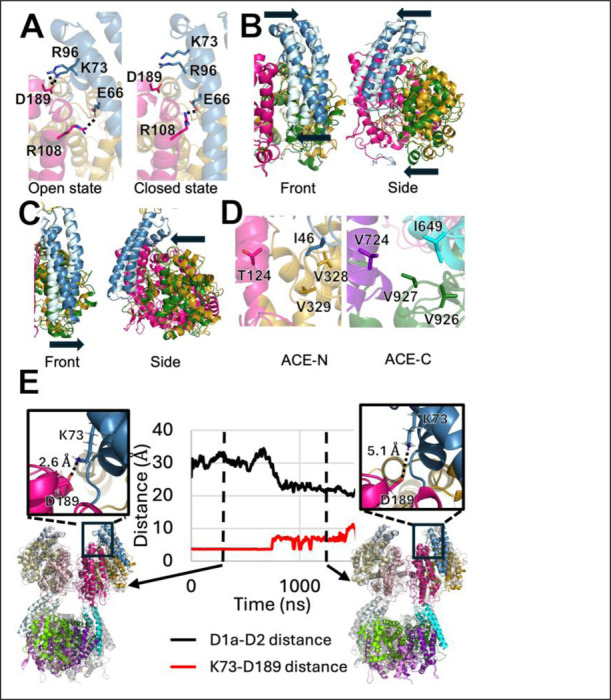
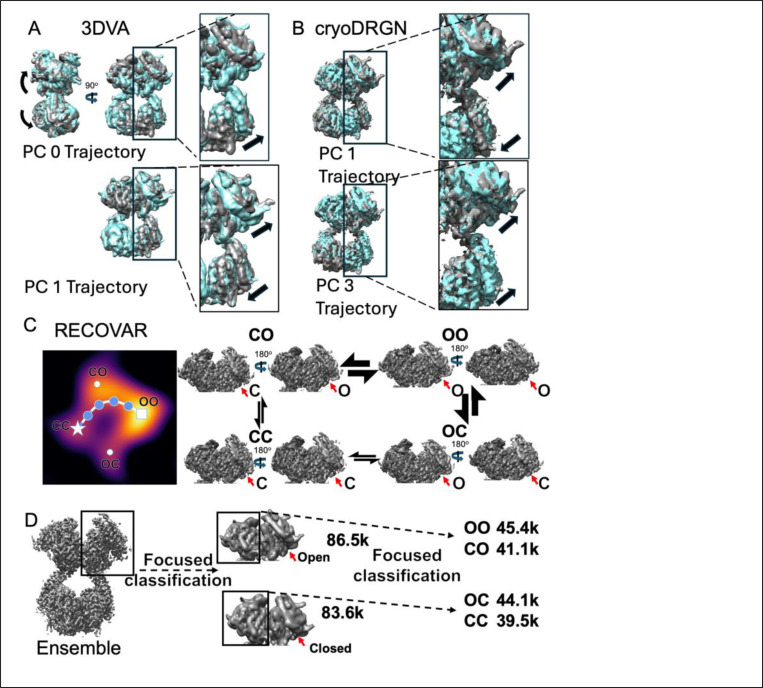
Angiotensin-I converting enzyme (ACE) regulates the levels of disparate bioactive peptides, notably converting angiotensin-I to angiotensin-II and degrading amyloid beta. ACE is a heavily glycosylated dimer, containing 4 analogous catalytic sites, and exists in membrane bound and soluble (sACE) forms. ACE inhibition is a frontline, FDA-approved, therapy for cardiovascular diseases yet is associated with significant side effects, including higher rates of lung cancer. To date, structural studies have been confined to individual domains or partially denatured cryo-EM structures. Here we report the cryo-EM structure of the glycosylated full sACE dimer. We resolved four structural states at 2.99 to 3.65 Å resolution which are primarily differentiated by varying degrees of solvent accessibility to the active sites and reveal the full dimerization interface. We also employed all-atom molecular dynamics (MD) simulations and heterogeneity analysis in cryoSPARC, cryoDRGN, and RECOVAR to elucidate the conformational dynamics of sACE and identify key regions mediating conformational change. We identify differences in the mechanisms governing the conformational dynamics of individual domains that have implications for the design of domain-specific sACE modulators.

Keywords: Angiotensin-I converting enzyme; all-atom MD simulations; amyloid peptide; cryo-EM; hypertension.


Figures

Figure 1:
Figure 1:
Cryo-EM analysis of human sACE dimer. (A) Diagram for the key features of domain on primary sequence of human ACE. The construct used in this study contains the first 1235 residues, which we refer to as the soluble region of ACE (sACE) however, the first 29 residues comprise a signal. By convention, sACE is labeled based on the mature, processed peptide (68). D1a and D3a domains, also called “lid” encompasses residues 1–98 and aa 616–696, respectively. D1b and D3b domains each have two discrete segments; residues 263–436 and 496–574 for D1b and residues 868–1031 and 1091–1171 for D3b. D2 encompasses three discrete segments, residues 99–262, 437–495, and 575–615 while D4 domain encompasses residues 697–867, 1032–1090, and 1172–1202. sp = signal peptide. asterisk = zinc binding motif. Colored by sub-domain: D1a blue, D1b gold, D2 magenta, D3a cyan, D3b green, D4 purple. (B) 2D classification of human sACE particles from grids made by vitrobot (360 pixels box size) and Chameleon (256 pixels box size). Clear four domain classes visible in the Chameleon-derived classification are boxed in red, similar views are lacking in the vitrobot dataset. White scale bar measures 100 Å. (C) Full-length sACE 3D volumes, colored by sub-domain as in (A). Chain B sub-domains are depicted as lighter tones of their chain A counterparts. Glycan density is shown in gray. See Figure S2 for vitrobot-prepared data processing details, Figure S4 for Chameleon-prepared data processing details and Table S2 for data refinement statistics.
Figure 2:
Figure 2:
Overall structure of human sACE. (A) Overlay comparing sACE-N states highlighting the structure differences between the closed “C”, intermediate “I”, and open “O” states. (B) Overlay comparing sACE-C states highlighting the structure differences between the closed “C”, and intermediate “I” states. We define the state based on the distance between the edge of the D2/4 domain bordering the catalytic cleft (residues 121–126 or 721–726) and the tip of the D1/3a region (residues 41–51 or 647–657): closed <15 Å, intermediate >15 Å and <19 Å, open >19 Å. (C) Overall dimer comparisons. Black bracket depicts the D1/3a-D2/4 distance measurement used to define the state of each domain, as described above. (D) Table of openness measurements for each domain per structure.
Figure 3:
Figure 3:
sACE dimerization interfaces. (A) Overlay comparing sACE-N/N interface (blue) and sACE-C/C (gold) interfaces. Interfaces adopt the same secondary structure but interacting residues vary between them. (B) Residue-specific interactions at the sACE-N/N interface, see text for details. (C) Unsharpened Coulomb potential density map (blue) showing density corresponding to glycan-glycan interaction from N82 as part of sACE-N/N interface. Sharpened map is shown in magenta for reference. (D) Residue-specific interactions in the sACE-C/C interface, see text for details.
Figure 4:
Figure 4:
Comparison of molecular dynamics simulations with cryo-EM data. (A) Alpha carbon displacement values for each residue were calculated by comparing each of our cryo-EM structures against one another in a pairwise manner and averaged. Individual residues are colored by sub-domain as defined in figure 1. Alpha carbon displacement values were also mapped onto the structure of sACE to better visualize the mobile regions. Residues are colored by degree of displace from blue (no displacement) to red (high displacement, values in Angstrom, as indicated). Numbers denote regions of interest: 1, the top of the D1a sub-domain, 2, the bottom of the D1a sub-domain, 3, a flexible loop region within the D1b that interacts with the bottom of the D1a sub-domain near the catalytic cleft, 4, the bottom of the D3A sub-domain. (B) Alpha carbon RMSF values for a representative 100 ns subset from our non-glycosylated MD simulations that demonstrates the simulated dynamics correlate well with displacement calculated from the cryo-EM structures. (C) Alpha carbon RMSF values for the entirety of our non-glycosylated MD simulations. Mobile regions agree with predictions from the cryo-EM structures, yet the magnitude is dampened due to the protein rapidly transitioning from an open state to a closed state and remaining closed for most of the simulation time. (D) Alpha carbon RMSF values for a representative 100 ns subset from our glycosylated MD simulations. (E) Alpha carbon RMSF values for the entirety of our glycosylated MD simulations.
Figure 5:
Figure 5:
Structural mechanism of the sACE open/close transition. (A) sACE-N overlay comparing the open (left panel) and closed (right panel) states in detail. The open state is stabilized by interaction between residues in the D1a (blue) and D2 (magenta) regions that, notably K73-D189. In the closed state, the K73-D189 interaction is broken. (B) Overlay of the sACE-N open (dark shades, sub-domains colored as above) and closed (light shades, sub-domains colored as above) states showing the range of motion. The D1a region rotates about a fulcrum region described in (A), while the D1b region moves as a rigid body. Front view arrows depict the “fulcrum” motion of the D1a subdomain, with the top and bottom of the subdomain moving in opposite directions. Side view arrows depict rigid body motion of the D1a and D1b subdomains moving together. (C) Overlay of sACE-C closed (light shades, sub-domains colored as above) and intermediate (dark shades, sub-domains colored as above) states. Unlike sACE-N, the “top” of the D3a region is constrained by its connection to sACE-N and largely immobile. The primary source of opening is only the motion of the D3a tip. We did not observe any open state structures of sACE-C, suggesting a smaller range of motion relative to sACE-N. Front view arrow depicts motion of D3a subdomain. Only the bottom of the subdomain moves, in contrast to the “fulcrum” motion observed in the D1a subdomain. Side view depicts the rigid body motion of the D3a and D3b subdomains moving together. (D) Comparison of the hydrophobic “latch” region formed in the closed state between residues of the D1/3a, D1/3b, and D2/D4 domains. V724 in sACE-C has been replaced by T124 in sACE-N, suggesting that the closed state in sACE-N may be less stabilized than the sACE-C closed state. (E) Example all-atom MD simulation tracking the openness of one sACE-N region (black line) and this distance between K73 and D189 (red line). These residues form a salt bridge early in the simulation when sACE-N is open (left inset) but the interaction breaks as sACE-N transitions to the closed state (right inset). Distance measurements for MD simulations were consistently greater than distance values in our static structures and cannot be directly compared to Figure 2.
Figure 6:
Figure 6:
Cryo-EM heterogeneity analysis. (A) Visualization of the structural changes revealed by cryoSPARC 3DVA trajectories calculated along two principal components (PCs) of structural variance. Starting states are showing in cyan, ending states in gray. PC 0 reveals a large, inter-domain bending motion accompanied by the open/close transition in sACE-C. PC 1 and the remaining PCs are dominated by the open/close transition of individual regions. See Table S3, and Movie S9 for additional details. Arrows depict generalized motions. (B) Visualization of the structural changes revealed by the cryoDRGN trajectories calculated along two PCs of structural variance. Starting states are shown in cyan, ending states in gray. PCs are dominated by the open/close transition of individual regions. See Table S3, and Movie S10 for additional details. Arrows depict generalized motions. (C) Analysis in RECOVAR with a focus mask on sACE-N/N reveals that particles adopt roughly four clusters within the latent space (heat map of particle density) corresponding to the open-open (OO, white square), open-closed (OC, white dot), closed-open (CO, white dot) and closed-closed (CC, white star) states of sACE-N/N. A trajectory estimating the path through latent space corresponding to the structural transition from sACE-N/N CC state to the OO state (blue points) suggests that individual sACE regions transition at different rates, as indicated by the size of the transition arrows between states. See Movie S11 for trajectory. (D) Focused 3D classification was performed in cryoSPARC to explore evidence of coordinated motion between sACE-N regions. 3D classification focusing on one sACE-N region revealed 2 roughly equal classes of particles: open and closed. Subsequent 3D classification focused on the other sACE-N region again revealed 2 roughly equal classes, suggesting the lack of coordinated motion between sACE-N regions in the absence of substrate.

Similar articles

References

    1. Bernstein K. E. et al. , A Modern Understanding of the Traditional and Nontraditional Biological Functions of Angiotensin-Converting Enzyme. Pharmacol Rev 65, 1–46 (2013). - PMC - PubMed
    1. Lubbe L., Cozier G. E., Oosthuizen D., Acharya K. R., Sturrock E. D., ACE2 and ACE: structure-based insights into mechanism, regulation and receptor recognition by SARS-CoV. Clin Sci 134, 2851–2871 (2020). - PMC - PubMed
    1. Turner A. J., Hooper N. M., The angiotensin-converting enzyme gene family: genomics and pharmacology. Trends Pharmacol Sci 23, 177–183 (2002). - PubMed
    1. Herman L. L., Padala S. A., Ahmed I., Bashir K., “Angiotensin-Converting Enzyme Inhibitors (ACEI)” in StatPearls. (Treasure Island (FL) ineligible companies. Disclosure: Sandeep Padala declares no relevant financial relationships with ineligible companies. Disclosure: Intisar Ahmed declares no relevant financial relationships with ineligible companies. Disclosure: Khalid Bashir declares no relevant financial relationships with ineligible companies., 2024).
    1. Wu Z. C. et al. , Association between angiotensin-converting enzyme inhibitors and the risk of lung cancer: a systematic review and meta-analysis. Brit J Cancer 128, 168–176 (2023). - PMC - PubMed

Publication types

LinkOut - more resources