. 2025 Jan;14(1):e70038.
doi: 10.1002/jev2.70038.

Breast Cancer-Derived Extracellular Vesicles Modulate the Cytoplasmic and Cytoskeletal Dynamics of Blood-Brain Barrier Endothelial Cells

Affiliations

Breast Cancer-Derived Extracellular Vesicles Modulate the Cytoplasmic and Cytoskeletal Dynamics of Blood-Brain Barrier Endothelial Cells

Sara Busatto et al. J Extracell Vesicles. 2025 Jan.

Abstract

Extracellular vesicles (EVs) from brain-seeking breast cancer cells (Br-EVs) breach the blood-brain barrier (BBB) via transcytosis and promote brain metastasis. Here, we defined the mechanisms by which Br-EVs modulate brain endothelial cell (BEC) dynamics to facilitate their BBB transcytosis. BEC treated with Br-EVs show significant downregulation of Rab11fip2, known to promote vesicle recycling to the plasma membrane and significant upregulation of Rab11fip3 and Rab11fip5, which support structural stability of the endosomal compartment and facilitate vesicle recycling and transcytosis, respectively. Using machine learning and quantitative global proteomic, we identified novel Br-EV-induced changes in BECs morphology, motility, and proteome that correlate with decreased BEC cytoplasm and cytoskeletal organization and dynamics. These results define early steps leading to breast-to-brain metastasis and identify molecules that could serve as targets for therapeutic strategies for brain metastasis.

Keywords: blood‐brain barrier; brain metastasis; breast cancer; exosomes; extracellular vesicles; microvesicles; pre‐metastatic niche.


Conflict of interest statement

The authors declare no conflicts of interest.

Figures
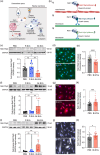
FIGURE 1
FIGURE 1
Extracellular vesicles derived from brain‐seeking MDA‐MB‐231 cells (Br‐EVs) modulate the expression of multiple Rab11 effector proteins (rab11fips) involved in intracytoplasmic vesicle trafficking and recycling. (a) Schematic representing degradation and recycling pathways in brain endothelial cells (BECs). Created using Biorender. (b) Schematic depicting the most widely acknowledged mechanisms of interaction between Rab11fip2, Rab11fip3, Rab11fip5, and the respective motor proteins for the tethering and transport of rab11 vesicles on cytoskeleton filaments. Created using Biorender. (c–e) Western blot quantification, representative immunofluorescent image, and fluorescence intensity quantification of Rab11fip2, (f–h) Rab11fip3, and (j–k) Rab11fip5 protein expression in BECs following treatment with PBS, P‐EVs, and Br‐EVs (mean ± SD; technical triplicates in 3 independent experiments). Scale bars 100 µm. Statistical analyses were performed using the Kruskal–Wallis test with Dunn's multiple comparisons test (c, f, i) and the Mann–Whitney test (e, h, k) (Wu and Voeltz , Lee et al. 2019). In all displayed graphs, ns = not significant; *p ≤ 0.0332; **p ≤ 0.0021; ***p ≤ 0.0002; ****p ≤ 0.0001. EHD‐1, EH domain‐containing protein 1; GAPDH, glyceraldehyde 3‐phosphate dehydrogenase; SD, standard deviation.
FIGURE 2
FIGURE 2
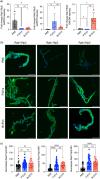
Cerebral microvessels isolated from the brain cortex of mice treated with Br‐EVs show decreased Rab11fip2 and increased Rab11fip3 and Rab11fip5 levels in response to Br‐EV treatment. (a) Western blot quantification of Rab11fip2, Rab11fip3, and Rab11fip5 in cerebral microvessel lysates of mice treated with PBS, P‐EVs, and Br‐EVs. PBS, P‐EV and Br‐EV groups were run on separate gels under the same conditions and normalization to GAPDH was performed individually for each sample with raw values being presented. Uncropped gels are provided in the Figure S5 (mean ± SD; n = 4 for PBS and Br‐EV groups and n = 6 and 5 for the P‐EV group). (b) Representative fluorescent images of cerebral microvessels from the brains of mice treated with PBS, P‐EVs, and Br‐EVs and stained with Rab11fip2, Rab11fip3, and Rab11fip5 (green) and nuclei (blue). Scale bars 50 µm. (c) Quantification of the signal mean fluorescence intensity (MFI) of the cerebral microvessels of mice treated with PBS, P‐EVs, and Br‐EVs and stained for Rab11fip2, Rab11fip3, and Rab11fip5 (normalized to the image background; mean ± SD; n = 5 for the PBS group, n = 6 for the P‐EV group, and n = 4 for the Br‐EV group). Statistical analysis was performed using the Mann–Whitney test (a) and one‐way ANOVA with Tukey's multiple comparison test (c) (Wu and Voeltz ; Lee et al. ; Mohrmann et al. ; Busatto et al. 2020). ns = not significant; *p ≤ 0.0332; **p ≤ 0.0021; ****p ≤ 0.0001.
FIGURE 3
FIGURE 3
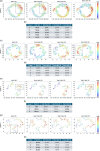
BEC monolayers treated with Br‐EVs exhibit characteristic morphology patterns when analysed by machine learning (ML). (a–c) Uniform Manifold Approximation and Projection (UMAP) (Stringer et al. 2021) of the BEC population treated with (a) PBS, (b) P‐EVs, and (c) Br‐EVs and analysed by confocal microscopy. (d) Confocal microscopy data spectral clustering with Silhouette score (McInnes, Healy, and Melville 2018). (e and f) Bar plot and table reporting cluster distribution variations (Jaqaman et al. 2008) and percentages in PBS, P‐EV, and Br‐EV samples. (g) Heatmap showing how the different morphological features distribute among the identified clusters. (h–j) UMAP representation of the BEC population treated with (h) PBS, (i) P‐EVs, and (j) Br‐EVs and analysed by live cell imaging. (k) Live cell imaging data spectral clustering with Silhouette score. (l and m) Bar plot and table showing cluster distribution variations and percentages in PBS, P‐EV, and Br‐EV samples. (n) Heatmap showing how the different morphological features distribute among the identified clusters. (d and k) Cluster 1 in blue, cluster 2 in orange, cluster 3 in green, and cluster 4 in red. Statistical analysis was performed using Bootstrap resampling with the z‐test method (Godinho‐Pereira et al. 2021). *p ≤ 0.05; ****p ≤ 0.0001.
FIGURE 4
FIGURE 4
BEC monolayers treated with Br‐EVs exhibit characteristic motility patterns when analysed by machine learning (ML). (a–c) UMAP (Stringer et al. 2021) of the BEC population treated with (a) PBS, (b) P‐EVs, and (c) Br‐EVs and analysed by QPI. (d) QPI data spectral clustering with Silhouette score (McInnes, Healy, and Melville 2018). Cluster 1 in blue, cluster 2 in orange, and cluster 3 in green. (e and f) Bar plot and table reporting cluster distribution (Jaqaman et al. 2008) variations and percentages in PBS, P‐EV, and Br‐EV samples. (g) Heatmap showing how the different morphological features distribute among the identified clusters. (h–j) UMAP representation of the BEC population treated with (h) PBS, (i) P‐EVs, and (j) Br‐EVs and analysed by live cell imaging. (k) Live cell imaging data spectral clustering with Silhouette score. Cluster 1 in blue, cluster 2 in orange, cluster 3 in green, and cluster 4 in red. (l and m) Bar plot and table showing cluster distribution variations and percentages in PBS, P‐EV, and Br‐EV samples. (n) Heatmap showing how the different morphological features distribute among the identified clusters. Statistical analysis was performed using Bootstrap resampling with z‐test method (Romano et al. 2022). *** p ≤ 0.001, ****p ≤ 0.0001.
FIGURE 5
FIGURE 5
BECs knocked down (KD) for Rab7 and overexpressing (OE) Rab11fip5 display motility and morphology patterns similar to those of BECs treated with Br‐EVs. UMAP representation of BEC populations KD for Rab7 and Rab11fip2 and OE for Rab11fip3 and Rab11fip5 (from left to right), analysed for morphology features using (a) confocal microscopy (to be compared with Figure 3c) and (c) live cell imaging (to be compared with Figure 3j), and for motility features using (e) QPI (to be compared with Figure 4c) and (g) live cell imaging (to be compared with Figure 4j). (b, d, f and h) Tables showing variations in cluster distribution and the percentage of each cluster within each respective sample.
FIGURE 6
FIGURE 6
In vivo, Br‐EVs induce significant changes in cerebral microvessel protein expression. (a) Correlation heatmap displaying the correlations between PBS, P‐EVs, and Br‐EVs samples in a color‐coded matrix (+1 = blue = positive correlation, −1 = red = negative correlation). (b) Heatmap visualization of whole quantitative proteomics analyses showing the proteins differentially expressed (log 2‐fold change 0.5, q ≤ 0.05) in the cerebral microvessels isolated from brains of mice injected with PBS, P‐EVs, and Br‐EVs. (c) The top 20 significantly upregulated and (d) downregulated proteins in Br‐EV samples compared to PBS controls. (e) Ingenuity Pathway Analysis (IPA) (Kramer et al. 2014) of the top significantly modulated biological functions in Br‐EV samples compared to PBS controls, blue represents the biological functions with predicted downregulation (z‐score < −1) and red represents the biological functions with predicted upregulation (z‐score > 1). (f) Western blot quantification of NKCC1 protein expression in BECs following treatment with PBS, P‐EVs, and Br‐EVs (normalized to GAPDH, mean ± SD; technical triplicates in 3 independent experiments). (g) Representative NKCC1 immunoblot (mean ± SD; technical triplicates in 3 independent experiments). Comparison analysis (a–e) was performed using R and IPA software (n = 5 per group). Statistical analysis was performed using the Kruskal–Wallis test with Dunn's multiple comparisons test (f) (Vrbin ; Hazra and Gogtay 2016). *p ≤ 0.032.
FIGURE 7
FIGURE 7
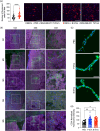
Br‐EVs cause increased MDA‐MB‐231 TNBC cell adhesion to BECs and CD31 expression in mouse brains and isolated cerebral microvessels. (a) Fluorescent cell counts (left) and representative images (right) demonstrate that MDA‐MB‐231 TNBC cells adhere more significantly to BEC monolayers pre‐treated with Br‐EVs compared to PBS controls (mean ± SD; three independent experiments). (b) Representative fluorescence microscopy images of the brain sections of mice treated with Br‐EVs (n = 5) stained for BECs (CD31, green), mature neurons (MAP2, magenta), and nuclei (DAPI, blue). Scale bars 200 µm (right), 100 µm (middle), and 50 µm (right). (c) Representative fluorescence microscopy images of the expression of CD31 (green) and nuclei (blue) in the cerebral microvessels isolated from the brains of mice treated with phosphate buffer saline (PBS), parental MDA‐MB‐231‐derived EVs (P‐EVs), or Br‐EVs (n = 5). Scale bars 50 µm. (d) Quantification of CD31 signal fluorescence intensity in cerebral microvessels treated with PBS, P‐EVs, or Br‐EVs. Statistical analysis was performed using (a) the Mann–Whitney t‐test and (c) the one‐way ANOVA with Tukey's multiple comparison test (Lee et al. ; Mohrmann et al. 2002). ns = not significant; *p ≤ 0.032; **p ≤ 0.0021; ****p ≤ 0.0001.

References

    1. Adams, R. A. , Passino M., Sachs B. D., Nuriel T., and Akassoglou K.. 2004. “Fibrin Mechanisms and Functions in Nervous System Pathology.” Molecular Interventions 4, no. 3: 163–176. 10.1124/mi.4.3.6. - DOI - PubMed
    1. Ai, E. , and Skop A. R.. 2009. “Endosomal Recycling Regulation During Cytokinesis.” Communicative and Integrative Biology 2, no. 5: 444–447. 10.4161/cib.2.5.8931. - DOI - PMC - PubMed
    1. Andrew, Y. , Ng M. I. J., Weiss Y.. 2001. On Spectral Clustering: Analysis and an Algorithm. Cambridge, MA: MIT Press.
    1. Ben‐Ari, Y. . 2017. “NKCC1 Chloride Importer Antagonists Attenuate Many Neurological and Psychiatric Disorders.” Trends in Neuroscience 40, no. 9: 536–554. 10.1016/j.tins.2017.07.001. - DOI - PubMed
    1. Bonomini, F. , and Rezzani R.. 2010. “Aquaporin and Blood Brain Barrier.” Current Neuropharmacology 8, no. 2: 92–96. 10.2174/157015910791233132. - DOI - PMC - PubMed

Substances

LinkOut - more resources