. 2025 Apr 2;24(4):587-604.
doi: 10.1158/1535-7163.MCT-24-0509.

VAX014 Activates Tumor-Intrinsic STING and RIG-I to Promote the Development of Antitumor Immunity

Affiliations

VAX014 Activates Tumor-Intrinsic STING and RIG-I to Promote the Development of Antitumor Immunity

Kinsey L Nelson et al. Mol Cancer Ther. .

Abstract

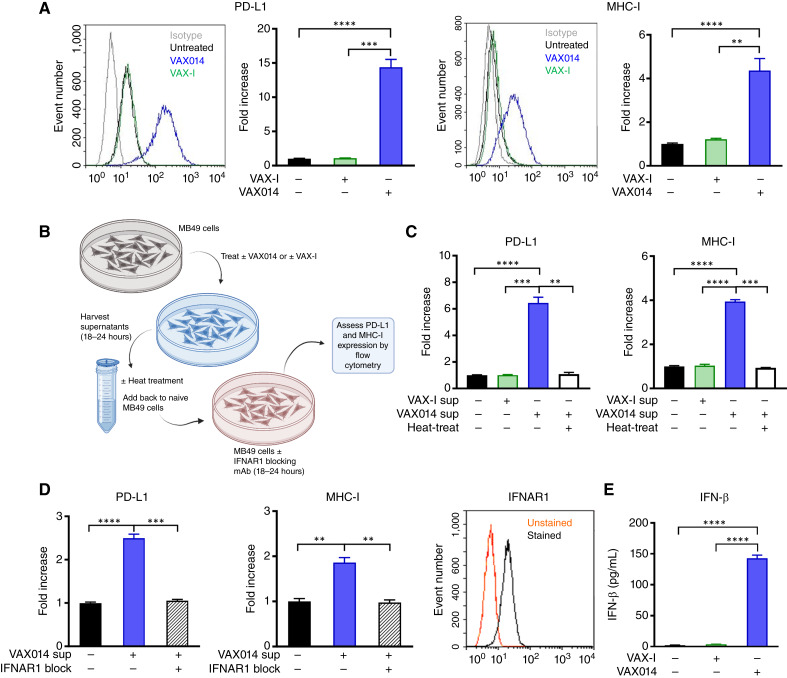
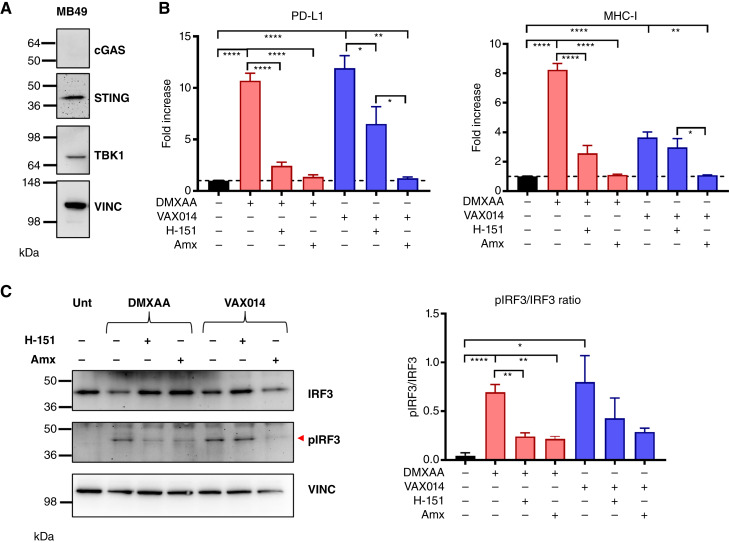
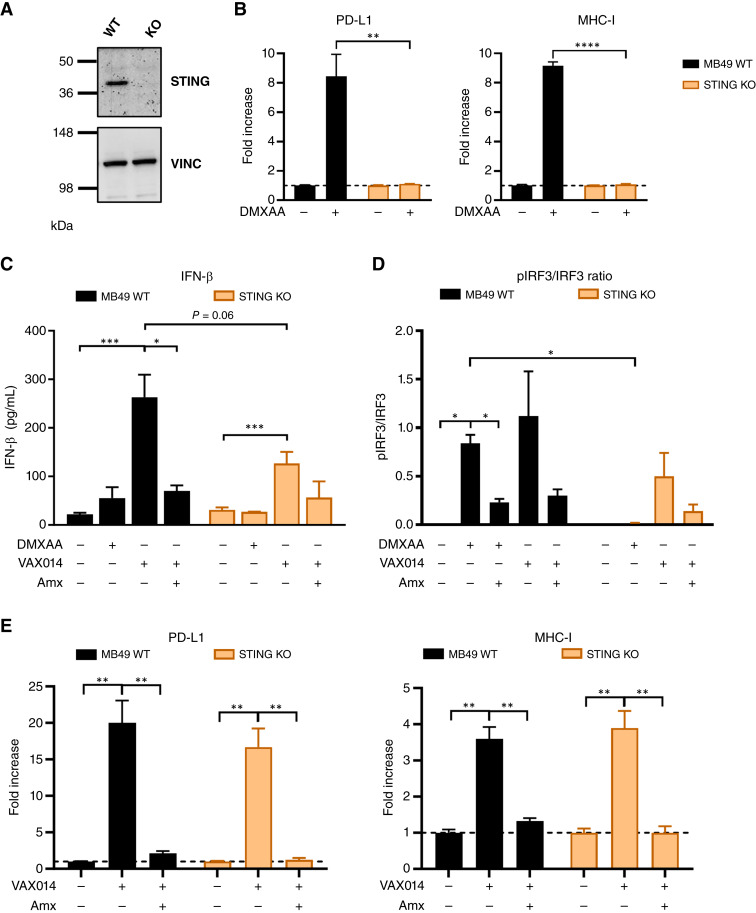
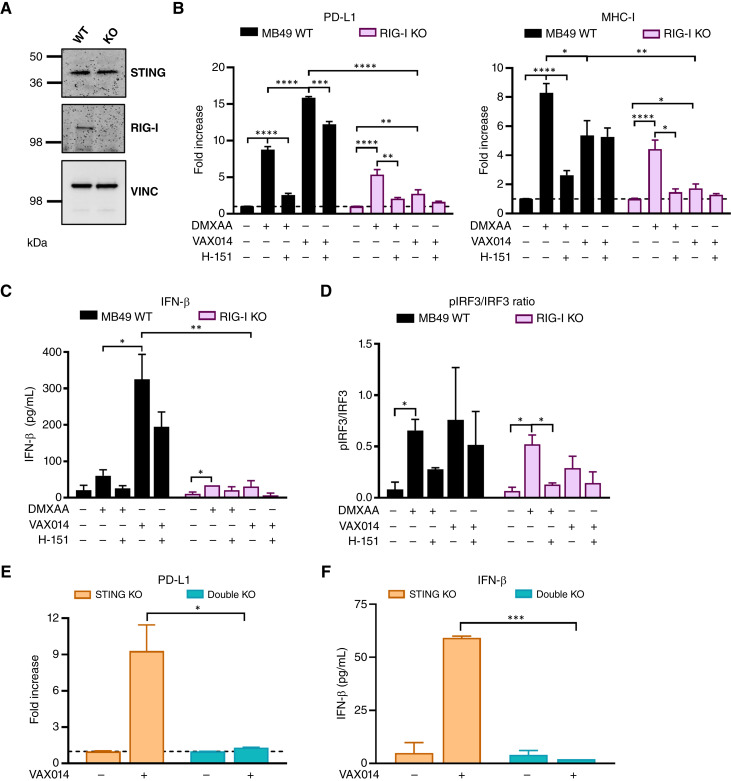
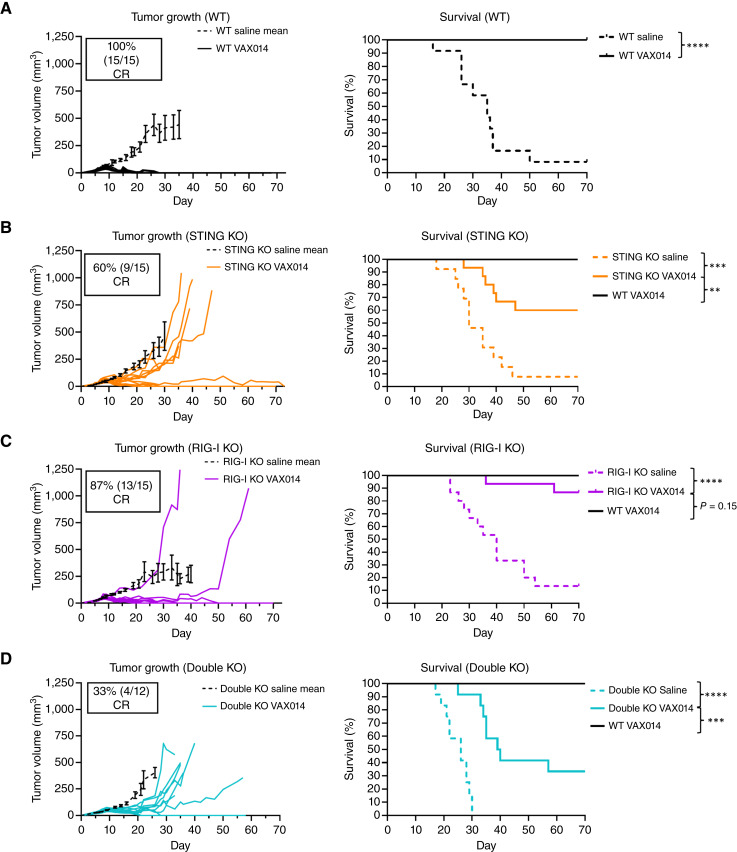
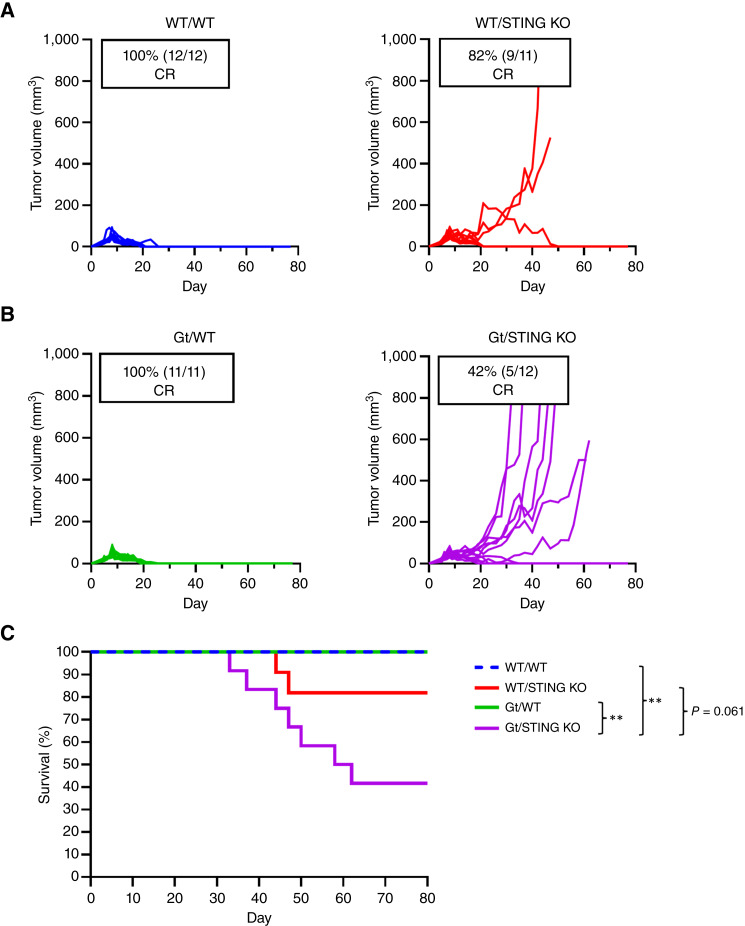
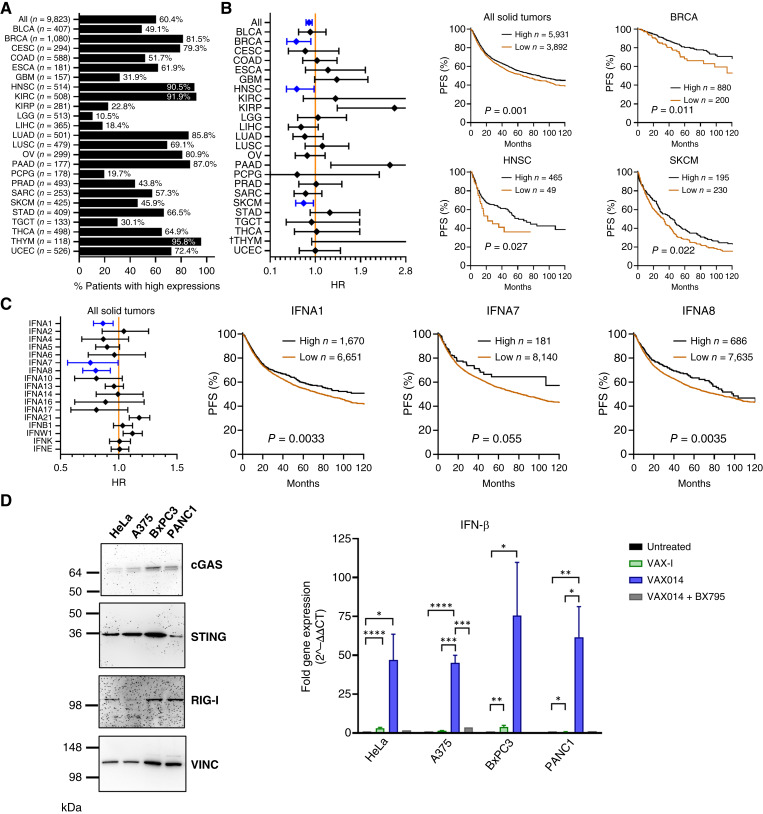
In situ immunization (ISI) has emerged as a promising approach to bolster early phases of the cancer immunity cycle through improved T-cell priming. One class of ISI agents, oncolytic viruses (OV), has demonstrated clinical activity, but overall benefit remains limited. Mounting evidence suggests that due to their inherent vulnerability to antiviral effects of type I IFN, OVs have limited activity in solid tumors expressing stimulator of interferon genes (STING) and/or retinoic acid-inducible gene I (RIG-I). Here, using a combination of pharmacologic, genetic, and in vivo approaches, we demonstrate that VAX014, a bacterial minicell-based oncolytic ISI agent, activates both STING and RIG-I and leverages this activity to work best in STING-positive and/or RIG-I-positive tumors. Intratumoral treatment of established syngeneic tumors expressing STING and RIG-I with VAX014 resulted in 100% tumor clearance in two mouse models. Antitumor activity of VAX014 was shown to be dependent on both tumor-intrinsic STING and RIG-I with additive activity stemming from host-intrinsic STING. Analysis of human solid tumor datasets demonstrated STING and RIG-I co-expression is prevalent in solid tumors and associates with clinical benefit in many indications, particularly those most amenable to intratumoral administration. These collective findings differentiate VAX014 from OVs by elucidating the ability of this agent to elicit antitumor activity in STING-positive and/or RIG-I-positive solid tumors and provide evidence that STING/RIG-I agonism is part of VAX014's mechanism of action. Taken together, this work supports the ongoing clinical investigation of VAX014 treatment as an alternative to OV therapy in patients with solid tumors.


Conflict of interest statement

C.D. House reports grants from Vaxiion Therapeutics during the conduct of the study, as well as grants from the NCI and the Conrad Prebys Foundation outside the submitted work. K.L. McGuire reports grants from Vaxiion Therapeutics during the conduct of the study. M.J. Giacalone reports a patent for PCT/US2024/011105 pending. No disclosures were reported by the other authors.

Figures

Figure 1.
Figure 1.
VAX014 facilitates PFO-dependent production of IFN-β to upregulate surface expression of PD-L1 and MHC-I in MB49 cells. MB49 cells were plated (5.0 × 10⁵ cells/well) and treated with VAX-I (control rBMC containing no PFO) or VAX014 rBMCs at an MOI of 300 for ∼20–24 hours. A, Surface expression of PD-L1 and MHC-I in viable MB49 cells analyzed by flow cytometry (n = 3–7). B, Experimental setup for supernatant transfer experiments (C and D). C, Surface expression of PD-L1 and MHC-I in MB49 cells co-incubated with VAX-I–treated or VAX014-treated MB49 supernatants ± heat treatment (n = 2–3). D, Surface expression of PD-L1 and MHC-I in MB49 cells ± IFNAR1 blockade co-incubated with VAX014-treated MB49 supernatants and surface expression of IFNAR1 in MB49 cells (n = 3). E, IFN-β secreted by MB49 cells as measured via ELISA (n = 3). Raw flow cytometry data are representative, and histograms depict mean ± SEM of combined data from all experiments. **, ≤ 0.01; ***, P ≤ 0.001; and ****, P ≤ 0.0001. (B, was created with BioRender.com.)
Figure 2.
Figure 2.
VAX014 activates the STING pathway and at least one other cytosolic pathway that converges on TBK1. A, Expression of cGAS, STING, and TBK1 in MB49 cells analyzed via Western blot. Vinculin (VINC) was used as a loading control on each independent blot, and a representative blot is shown. Each blot was conducted at least twice. B and C, MB49 cells were plated (5.0 × 10⁵ cells/well) and treated with DMXAA (30 µg/mL) or VAX014 rBMCs (MOI 300) ± H-151 (4 µg/mL) or Amx (100 µg/mL) for ∼20 hours. B, Surface expression of PD-L1 and MHC-I in MB49 cells analyzed by flow cytometry. C, Representative Western blot of pIRF3 and IRF3 and quantification of pIRF3/IRF3 ratio in MB49 cells 4 hours after treatment with DMXAA or VAX014. Data are combined from at least three independent experiments. Histograms depict mean ± SEM of all combined experiments, and dashed lines represent the baseline expression value of the untreated control condition. *, P ≤ 0.05; **, ≤ 0.01; and ****, P ≤ 0.0001.
Figure 3.
Figure 3.
Targeted deletion of STING in MB49 cells reduces but does not eliminate TBK1-mediated IFN-β production. A, Expression of STING in MB49WT (WT) and MB49STING KO (STING KO) cells. Vinculin (VINC) was probed as a loading control, and the blot image shown is representative of at least two independent experiments. B–E, Cells were plated (5.0 × 10⁵ − 1.0 × 10⁶ cells/well) and treated with DMXAA (30 µg/mL) or VAX014 (MOI 300) ± Amx (100 µg/mL) for ∼20 hours. B, Surface expression of PD-L1 and MHC-I in response to DMXAA was determined by flow cytometry (n = 3). C, IFN-β in supernatants of treated cells measured via ELISA (n = 3–6). D, Ratio of pIRF3/IRF3 in cells 4 hours after treatment analyzed via Western blot (n = 2). E, Surface expression of PD-L1 and MHC-I following treatment with VAX014 ± Amx was determined by flow cytometry (n = 3). Histograms depict mean ± SEM of all combined experiments. Dashed lines represent the baseline expression value of the corresponding untreated control condition.*, P ≤ 0.05; **, ≤ 0.01; ***, P ≤ 0.001; and ****, P ≤ 0.0001.
Figure 4.
Figure 4.
VAX014 activates both STING and RIG-I in vitro in MB49. A, Expression of STING and RIG-I in MB49WT (WT) and MB49RIG-I KO (RIG-I KO) cells. Vinculin (VINC) was used as a loading control, and blot images are representative of at least two independent experiments. B–F, Cells were plated (5.0 × 10⁵ cells/well) and treated with DMXAA (30 µg/mL) or VAX014 (MOI 300) ± H-151 (4 µg/mL) for ∼20 hours. B, Surface expression of PD-L1 and MHC-I in WT vs. RIG-I KO cells in response to DMXAA or VAX014 in the presence of H-151 was determined via flow cytometry (n = 3–6). C, IFN-β in supernatants of treated cells measured via ELISA (n = 3–5). D, Ratio of pIRF3/IRF3 in cells 4 hours after treatment analyzed via Western blot. Histogram combines values from two independent experiments. E, Surface expression of PD-L1 in MB49STING KO (STING KO) or MB49STING/RIG-I KO (Double KO) cells was determined by flow cytometry (n = 3). F, IFN-β in supernatants of MB49 STING KO and MB49 Double KO cells as measured via ELISA (n = 2). Histograms depict mean ± SEM of all combined experiments. Dashed lines represent the baseline expression value of the corresponding untreated control condition. *, P ≤ 0.05; **, ≤ 0.01; ***, P ≤ 0.001; and ****, P ≤ 0.0001.
Figure 5.
Figure 5.
Antitumor activity of VAX014 is highest in tumors intrinsically positive for STING and RIG-I. —Nine- to seventeen-week-old female C57BL/6 mice (n = 12–15/group) were implanted with a single i.d. tumor as indicated in the figure on day 0. Weekly i.t. administration of saline or VAX014 was started on day 7 and continued until CR was achieved and there was no tumor left to inject or until termination criteria were reached. A–D, Individual tumor growth rates and Kaplan–Meier survival curves for (A) MB49WT (WT), (B) MB49STING KO (STING KO), (C) MB49RIG-I KO (RIG-I KO), and (D) MB49STING/RIG-I KO (Double KO) tumors. For tumor growth rate assessments, the mean saline tumor growth rates (black lines; mean ± SEM) were plotted until the median survival of the corresponding saline group. Individual VAX014-treated tumor growth rates were plotted until animal expiration or study termination. Log-rank test was used to analyze the significance in survival between each VAX014-treated group compared with its respective saline control and compared with the WT VAX014-treated group where applicable. **, ≤ 0.01; ***, P ≤ 0.001; and ****, P ≤ 0.0001.
Figure 6.
Figure 6.
Host STING contributes to the antitumor activity of VAX014 in vivo. —Seven- to ten-week-old female C57BL/6 mice (WT) or STING-deficient Goldenticket (Gt) mice (n = 11–12/group) were implanted with a single i.d. MB49WT (WT) or MB49STING KO (STING KO) tumor on day 0. Weekly i.t. treatments with VAX014 were started on day 7 and continued until CR and there was no tumor left to inject or until termination criteria were reached. Individual tumor growth rates from (A) WT mice bearing MB49 WT or MB49 STING KO tumors and (B) Gt mice bearing MB49 WT or MB49 STING KO tumors. Individual tumor growth rates are plotted until animal expiration or study termination. C, Kaplan–Meier survival curves for all groups. Log-rank test was used to analyze significance in comparison with the Gt/STING KO group. **, ≤ 0.01.
Figure 7.
Figure 7.
STING/RIG-I co-expression and elevated type I IFN correlates with improved clinical outcome across solid tumor types. A, Percentage of patients exhibiting high STING and RIG-I mRNA expression levels (defined as expression value higher than the 25th percentile for both genes among all TCGA Pan-Cancer Atlas expression data) from the cBioPortal database, excluding those solid tumor indications with fewer than 100 patient samples. The acronyms for the individual cancer indications follow the standard TCGA study abbreviations. B, Forest plot of HRs ± 95% confidence intervals as determined by Cox regression analysis of PFS based on the dual STING and RIG-I mRNA expression status. Those indications exhibiting HRs significantly lower than 1 are indicated in blue. Kaplan–Meier curves based on PFS of patients as categorized by low or high STING/RIG-I co-expression in all solid tumors and those indications most amenable to i.t. injection. The datasets cover all time points with a display cutoff of 120 months. C, Forest plot of HRs ± 95% confidence intervals as determined by Cox regression analysis of PFS based on mRNA expression status of individual type I IFN isotypes across all solid tumor indications. HRs significantly lower than 1 are indicated in blue. Individual Kaplan–Meier curves based on PFS for patient samples exhibiting low or high expression status of individual type I IFN isotypes associated with significantly reduced HRs. The datasets cover all time points with a display cutoff of 120 months. D, VAX014-mediated PFO-dependent IFN-β gene expression that may be abrogated by pharmacologic inhibition of TBK1 with BX795 in human solid tumor cell lines intrinsically positive for STING and RIG-I. Cells were treated with VAX-I or VAX014 rBMCs (±BX795) for 4 hours and analyzed by qRT-PCR (n = 2–4). Expression of human cGAS, STING, and RIG-I was analyzed by Western blot (n = 3). Each blot was run independently, and every blot was probed for vinculin (VINC) as a loading control. HR is greater than 10. *, P ≤ 0.05; **, ≤ 0.01; ***, P ≤ 0.001; and ****, P ≤ 0.0001.

Similar articles

Cited by

References

    1. Morad G, Helmink BA, Sharma P, Wargo JA. Hallmarks of response, resistance, and toxicity to immune checkpoint blockade. Cell 2022;185:576. - PubMed
    1. Chen DS, Mellman I. Oncology meets immunology: the cancer-immunity cycle. Immunity 2013;39:1–10. - PubMed
    1. Mellman I, Chen DS, Powles T, Turley SJ. The cancer-immunity cycle: indication, genotype, and immunotype. Immunity 2023;56:2188–205. - PubMed
    1. Budimir N, Thomas GD, Dolina JS, Salek-Ardakani S. Reversing T-cell exhaustion in cancer: lessons learned from PD-1/PD-L1 immune checkpoint blockade. Cancer Immunol Res 2022;10:146–53. - PubMed
    1. O'Donnell JS, Long GV, Scolyer RA, Teng MWL, Smyth MJ. Resistance to PD1/PDL1 checkpoint inhibition. Cancer Treat Rev 2017;52:71–81. - PubMed