. 2025 Jan 24;53(3):gkaf022.
doi: 10.1093/nar/gkaf022.

Methyl-dependent auto-regulation of the DNA N6-adenine methyltransferase AMT1 in the unicellular eukaryote Tetrahymena thermophila

Affiliations

Methyl-dependent auto-regulation of the DNA N6-adenine methyltransferase AMT1 in the unicellular eukaryote Tetrahymena thermophila

Lili Duan et al. Nucleic Acids Res. .

Abstract

DNA N6-methyladenine (6mA) is a potential epigenetic mark involved in gene transcription in eukaryotes, yet the regulatory mechanism governing its methyltransferase (MTase) activity remains obscure. Here, we exploited the 6mA MTase AMT1 to elucidate its auto-regulation in the unicellular eukaryote Tetrahymena thermophila. The detailed endogenous localization of AMT1 in vegetative and sexual stages revealed a correlation between the 6mA reestablishment in the new MAC and the occurrence of zygotically expressed AMT1. Catalytically inactive AMT1 reduced 6mA level on the AMT1 gene and its expression, suggesting that AMT1 modulated its own transcription via 6mA. Furthermore, AMT1-dependent 6mA regulated the transcription of its target genes, thereby affecting cell fitness. Our findings unveil a positive feedback loop of transcriptional activation on the AMT1 gene and highlight the crucial role of AMT1-dependent 6mA in gene transcription.


Conflict of interest statement

None declared.

Figures

Graphical Abstract
Graphical Abstract
Figure 1.
Figure 1.
Cellular localization of AMT1. (A) IF staining using anti-6mA antibody in HA-AMT1-MAC and WT cells. DNA was stained with DAPI. MIC was encircled by dotted line. (B) IF staining of HA-tagged AMT1 in somatic HA-AMT1-MAC cells. AMT1 (HA) was absent in the MIC (dotted circles). (C) IF staining of HA-tagged AMT1 in HA-AMT1-complete (MAC: AMT1 tagged by HA; MIC: tagged by HA), HA-AMT1-MAC (MAC: tagged by HA; MIC: WT), and HA-AMT1-MIC (MAC: WT; MIC: tagged by HA) cells during conjugation. Maternal AMT1 persisted until the 2MAC/2MIC stage and then rapidly diminished during the 2MAC/1MIC stage, as demonstrated in HA-AMT1-MAC cells. Zygotic AMT1 was absent in both the maternal MAC and the new MAC (dotted circles) at the Anlagen II stage, as shown in HA-AMT1-MIC cells. Zygotic AMT1 began to appear in the new MAC at the 2MAC/2MAC stage.
Figure 2.
Figure 2.
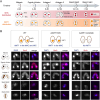
Cellular distribution of 6mA during conjugation. (A) Diagram showing the cellular localization of 6mA (top panel) and AMT1 (bottom panel) during conjugation. Nuclear events were used to ascertain conjugation stages. (B) IF staining of 6mA in WT (AMT1 was present in both MAC and MIC), ΔAMT1-MIC (AMT1 was deleted in the MIC), and ΔAMT1-complete (AMT1 was deleted in both MAC and MIC) cells during conjugation.
Figure 3.
Figure 3.
The reduction of AMT1 expression in AMT1-APPA cells. (A) Illustration of the AMT1 gene locus and its protein domain structure. (B) IF staining of HA-tagged AMT1 in HA-AMT1-MAC (WT) and HA-AMT1-APPA (APPA) cells. AMT1 (HA) was absent in the MIC (dotted circles). (C) Western blot of HA-tagged AMT1 in HA-AMT1-MAC (WT) and HA-AMT1-APPA (APPA) cells. Alpha-tubulin was used as the loading control. (D) IF staining of 6mA in WT, AMT1-APPA, and ΔAMT1 cells. 6mA was absent in the MIC (dotted circles). (E) Mass spectrometry analysis of 6mA levels in WT, AMT1-APPA, and ΔAMT1 cells. Data from three biological replicates were presented as histogram plots. Statistical analysis was performed using Student's t-test (****P < 0.0001). (F). Distributions of 6mA, H3K4me3, H2A.Z, and nucleosome in the AMT1 gene locus (TTHERM_00704040) in WT cells. IGV (Integrative Genomics Viewer) snapshot tracks from top to bottom were as follows: gene model, 6mA levels, H2A.Z (ChIP and Input), H3K4me3 (ChIP and Input), and dyads of nucleosomes. (G). Scatterplot depicting the amount of ApT and 6mApT on all genes. Note that the 6mApT/ApT ratio on the AMT1 and RAB46 gene bodies (6mApT/ApT: 11.71% on AMT1, and 8.52% on RAB46) was higher than the average level (3.07%).
Figure 4.
Figure 4.
6mA distribution in AMT1-APPA and AMT1-RNAi cells. (A) Four states of ApT duplexes: full methylation (Full), 6mA methylation only on Watson strands (Hemi-W), 6mA methylation only on Crick strands (Hemi-C), and unmethylation (Un), distinguished by IPD ratios of adenine sites on Watson strand (W) and Crick strand (C), respectively. The IPD ratios and dispersion in typical single molecules were plotted for an 8-bp region containing one ApT site. (B) Demarcation of the four methylation states of ApT duplexes in WT (left), AMT1-APPA cells (middle), and AMT1-RNAi cells treated by 1 μg/ml Cd2+ for 17 h (right) by their IPD ratios on W and C strands, respectively. Note that WT cells contained abundant full methylation sites, which were nearly abolished in AMT1-APPA cells and decreased in AMT1-RNAi cells. The value represented the different IPD ratio cutoff. (C) Distribution of 6mA peaks around the gene body (TSS to TES) in WT, AMT1-APPA cells, and AMT1-RNAi cells treated by 1 μg/ml Cd2+ for 17 h. Genes were scaled to unit length and was extended to each side by unit length. One unit length was divided into 30 bins, and the degree of 6mA enrichment was calculated as the sum of penetrance within each bin. (D) IGV snapshot of the AMT1 gene locus. Tracks from top to bottom were as follows: gene model, 6mA levels (SMRT-CCS data) of WT and AMT1-APPA cells, and mRNA levels (RNA-seq data) of WTa (specifically for the transcription profile comparison with AMT1-APPA) and AMT1-APPA cells. (E) Single molecules covering the AMT1 gene locus (highlighted in the IGV snapshot of Fig. 4D) in WT (top) and AMT1-APPA (bottom) cells. Note that in AMT1-APPA cells, full-6mApT on the AMT1 gene was abolished, while the proportion of hemi-6mApT was increased compared to that in WT cells. (F) 6mA levels of individual genes were reduced in AMT1-APPA cells and AMT1-RNAi cells treated by 1 μg/ml Cd2+ for 17 h compared to WT cells. 6mA level of a specific gene was calculated as the sum of penetrance of all 6mApT positions on its gene body (ΣP). Note that the ΣP values for the AMT1 and RAB46 genes were located below the diagonal line (k = 1), indicating a greater reduction in their 6mA levels in AMT1-APPA and AMT1-RNAi cells. (G) qPCR analysis of 6mA IP samples and RT-qPCR of mRNA samples showed that both 6mA level and expression level of the endogenous AMT1 gene were increased in OE-AMT1-rescue (HA-AMT1-APPA) cells induced with 1 μg/ml Cd2+ for 17 h, compared to cells without induction. Unmethylated rDNA was used as the internal control for qPCR, while JMJ1 genes was used for RT-qPCR.
Figure 5.
Figure 5.
Gradual reduction of 6mA could be monitored by inducible AMT1-RNAi cells. (A) IF staining of HA-tagged AMT1 in AMT1-RNAi cells induced by 1 μg/ml Cd2+ for 0, 8, 11, 14, and 17 h. (B) Western blot of HA-tagged AMT1 in AMT1-RNAi cells induced by 1 μg/ml Cd2+ for 0, 8, 11, 14, and 17 h. AMT1-RNAi cells without cadmium induction (0 μg/ml Cd2+) were collected at the corresponding timepoints for comparison. Alpha-tubulin was used as the loading control. (C) Mass spectrometry analysis of 6mA levels in AMT1-RNAi cells induced by 1 μg/ml Cd2+ for 8, 11, 14, and 17 h. WT and ΔAMT1 cells were included as the controls to demonstrate the significant differences in 6mA levels. Three biological replicates were used for each sample. Data were presented as histogram plots. Student's t-test was performed (****P< 0.0001). (D) Overlapping genes with reduced 6mA levels and decreased mRNA expressions (log2FoldChange ≤ −1, Padj < 0.05) in ΔAMT1, AMT1-APPA, and AMT1-RNAi (induced with 1 μg/ml Cd2+ for 17 h) cells, compared to WT cells. A total of 795 genes (Group A) were downregulated in both AMT1-APPA and ΔAMT1 cells. A total of 141 genes (Group B) exhibited downregulation among these three strains. (E) GO term analysis on 795 genes (Group A) that were co-downregulated in both 6mA and transcription levels in ΔAMT1 and AMT1-APPA cells. GA indicated pathways unique to Group A, while the intersection of GA and GB highlighted the intersected pathways between Group A and Group B. The top 10 terms with the lowest P-values in each GO class were displayed.
Figure 6.
Figure 6.
Diagram denoting AMT1 auto-regulation and transcriptional regulation mediated by AMT1-dependent 6mA. Top: MAC of Tetrahymena thermophila contains 6mA in the ApT motif catalyzed by AMT1. Bottom left: AMT1 gene generates AMT1 protein, which then catalyzes 6mA on its own gene. Bottom right: AMT1 protein methylates other target genes, increasing their 6mA levels and thereby promoting their transcription.

Similar articles

Cited by

References

    1. Cummings DJ, Tait A, Goddard JM Methylated bases in DNA from Paramecium aurelia. Biochim Biophys Acta. 1974; 374:1–11. - PubMed
    1. Fu Y, Luo GZ, Chen K et al. . N6-methyldeoxyadenosine marks active transcription start sites in Chlamydomonas. Cell. 2015; 161:879–92. - PMC - PubMed
    1. Gorovsky MA, Hattman S, Pleger GL N6-methyl adenine in the nuclear DNA of a eucaryote, Tetrahymena pyriformis. J Cell Biol. 1973; 56:697–701. - PMC - PubMed
    1. Greer EL, Blanco MA, Gu L et al. . DNA methylation on N6-adenine in C. elegans. Cell. 2015; 161:868–78. - PMC - PubMed
    1. Liang Z, Shen L, Cui X et al. . DNA N6-adenine methylation in Arabidopsis thaliana. Dev Cell. 2018; 45:406–16. - PubMed

MeSH terms

Substances

LinkOut - more resources