. 2025 Jan;35(1):e3094.
doi: 10.1002/eap.3094.

Predicting the impact of targeted fence removal on connectivity in a migratory ecosystem

Affiliations

Predicting the impact of targeted fence removal on connectivity in a migratory ecosystem

Imogen A Schwandner et al. Ecol Appl. 2025 Jan.

Abstract

Fencing is one of the most widely utilized tools for reducing human-wildlife conflict in agricultural landscapes. However, the increasing global footprint of fencing exceeds millions of kilometers and has unintended consequences for wildlife, including habitat fragmentation, movement restriction, entanglement, and mortality. Here, we present a novel and quantitative approach to prioritize fence removal within historic migratory pathways of white-bearded wildebeest (Connochaetes taurinus) across Kenya's Greater Masai Mara Ecosystem. Our approach first assesses historic and contemporary landscape connectivity of wildebeest between seasonal ranges by incorporating two sets of GPS tracking data and fine-scale fencing data. We then predict connectivity gains from simulated fence removal and evaluate the impact of different corridor widths and locations on connectivity and removal costs derived from locally implemented interventions. Within the study system, we found that modest levels of fence removal resulted in substantial connectivity gains (39%-54% improvement in connectivity for 15-140 km of fence line removed). By identifying the most suitable corridor site, we show that strategically placed narrow corridors outperform larger, more expensive interventions. Our results demonstrate how and where targeted fence removal can enhance connectivity for wildlife. Our framework can aid in identifying suitable and cost-effective corridor restoration sites to guide decision-makers on the removal of fences and other linear barriers. Our approach is transferable to other landscapes where the removal or modification of fences or similar barriers is a feasible mitigation strategy to restore habitat and migratory connectivity.

Keywords: Circuitscape; East Africa; connectivity; corridors; fencing; grassland restoration; land‐use change; linear barriers; migration; pastoralism; ungulates; wildebeest.


Conflict of interest statement

The authors declare no conflicts of interest.

Figures
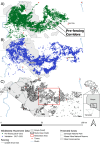
FIGURE 1
FIGURE 1
(A) Locations of pre‐fencing GPS collared wildebeest (n = 13 individuals, 2010–2013) corresponding to a period before fencing expansion. Broadscale movements were observed between the Mara Plains and the Loita Plains with three clear main migratory corridors in the East. (B) Locations of validation data GPS collared wildebeest (n = 9 individuals, 2017–2021) during a period of extensive fence densification (fencing period), in areas directly adjacent to private and community conservancies. (C) Fencing extent in 2022, based on the landDX database (Tyrrell et al., 2022). Restoration area of interest shown in red.
FIGURE 2
FIGURE 2
Graphical summary of the analytical approach. Datasets (top) highlighted in dark blue, intermediate and final outcomes in light blue, and Circuitscape analyses of connectivity in light gray. Layers altered for connectivity restoration modeling are highlighted in brown. Step one was to predict habitat suitability using a habitat selection model based on historic movement data. Using the inverse of suitability as a resistance surface, historic pre‐fencing (2010–2013) and fenced (2022) connectivity levels between specified focal areas were then predicted in Circuitscape either including (fenced) or excluding (pre‐fencing) fencing in the resistance surface. Validation movement data (2017–2021) were used to validate predicted outcomes (green arrows). Finally, we assessed the impact of simulated fence removal on connectivity restoration.
FIGURE 3
FIGURE 3
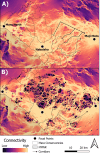
(A) Historic pre‐fencing (2010–2013) and (B) fenced (2022) connectivity levels for wildebeest across the Greater Masai Mara Ecosystem, based on Circuitscape models. Connectivity was measured as the cumulative current between three focal points: Maji Moto, a wet season area, and the Naboisho and Mara North conservancies, both dry season areas for wildebeest adjacent to the Masai Mara National Reserve (MMNR). Several corridors between Naboisho and Maji Moto are apparent and depicted as dashed (historically used corridors) and dotted (only modeled corridors) lines. All corridors north of the Naboisho conservancy have been lost or significantly altered following recent fencing (2022), with connectivity diverted through a single southern corridor (dotted line in B). We did not observe wildebeest using this route during the historic pre‐fencing tracking period (2010–2013). These patterns can already partially be observed in Figure 1.
FIGURE 4
FIGURE 4
Predicted change in wildebeest connectivity due to fencing between fenced (2022) and historic pre‐fencing (2010–2013) levels across the Greater Masai Mara Ecosystem, Kenya, based on Circuitscape models. Focal nodes of connectivity analysis appear as black dots with labels. Other labels show conservancies marking notable gains or losses.
FIGURE 5
FIGURE 5
Restoration corridor scenarios for fence removal. High‐current/connectivity areas (>0.003) during (A) pre‐fencing and (B) fenced period, based on Circuitscape models (Figure 3) and (C) three candidate routes connecting dry season ranges (Naboisho and Ol Kinyei conservancies) with the wet season range (Loita Plains). This particular area was chosen as a plausible site for simulated restoration because of observations of empirical movement data, historically high connectivity, and relatively low levels of fencing. Corridor widths of 0.5, 1, 2 and 3 km are illustrated for each of the three candidate routes. MMNR ‐ Masai Mara National Reserve.
FIGURE 6
FIGURE 6
Connectivity improvement (i.e., change in cumulative “current”) measured as percentage difference in connectivity between the historic (2010–2013) and fenced (2022) levels restored through fence removal as a function of estimated removal costs in US$ along three possible corridor locations (Corridors I, II, III) with four possible corridor widths each (0.5, 1, 2 and 3 km; see marker label). Costs based on the area of land parcels enclosed by fencing intercepting the corridor. Per acre of land approximately US$75 (10.000 KES) are paid (cost from Pardamat Conservation Area).

References

    1. Bartlam‐Brooks, H. L. A. , Bonyongo M. C., and Harris S.. 2011. “Will Reconnecting Ecosystems Allow Long‐Distance Mammal Migrations to Resume? A Case Study of a Zebra Equus Burchelli Migration in Botswana.” Oryx 45(2): 210–216. 10.1017/S0030605310000414. - DOI
    1. Bartoń, K. 2022. “MuMIn: Multi‐Model Inference.” R Package Version 1.46.0. https://CRAN.R-project.org/package=MuMIn.
    1. Bartzke, G. S. , Ogutu J. O., Mukhopadhyay S., Mtui D., Dublin H. T., and Piepho H.‐P.. 2018. “Rainfall Trends and Variation in the Maasai Mara Ecosystem and their Implications for Animal Population and Biodiversity Dynamics.” PLoS One 13: e0202814. 10.1371/journal.pone.0202814. - DOI - PMC - PubMed
    1. Bates, D. , Mächler M., Bolker B., and Walker S.. 2015. “Fitting Linear Mixed‐Effects Models Using lme4.” Journal of Statistical Software 67(1): 1–48. 10.18637/jss.v067.i01. - DOI
    1. Bauer, S. , and Hoye B. J.. 2014. “Migratory Animals Couple Biodiversity and Ecosystem Functioning Worldwide.” Science 344(6179): 1242552. 10.1126/SCIENCE.1242552. - DOI - PubMed

LinkOut - more resources